 RSS Feed
 by Calculated Risk on 8/31/2006 04:13:00 PM
Thursday, August 31, 2006
Retail: More Mixed Results
Looking forward to Starbucks' results, analysts thought same store sales of 4% would be a negative and 6%+ a positive. So naturally Starbucks reports:
On a comparable store sales basis (stores open for at least 13 months), sales at Company-operated stores increased five percent for the four weeks ended August 27, 2006, as compared to the same four-week period in fiscal 2005.Other retailers reported mixed results too (hat tip Barry Ritholtz): Back-to-school sales mediocre

According to sales tracker First Call, 50 percent of the 52 retailers it tracks beat their sales estimates and 48 percent missed. Total August comparable sales were up 3.7 percent. The firm had forecast sales to increase 3.5 percent, modestly lower than the 3.6 percent increase for the same period a year ago.
"We haven't yet seen a significant implosion in sales," said Perkins.
July Personal Income and Outlays
by Calculated Risk on 8/31/2006 12:41:00 PM
The BEA reported Personal Income and Outlays today for July. There are several positives for the economy in this report.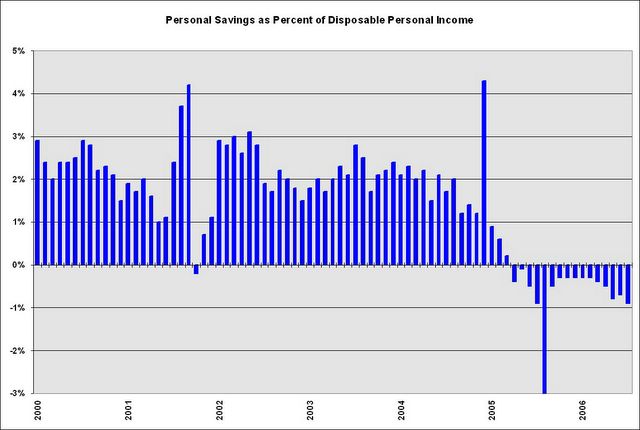 Click on graph for larger image.
The monthly savings rate can be event driven; both Hurricane Katrina, in August 2005, and the Microsoft special dividend, in December 2004, impacted the monthly savings rate.
The savings rate for July was negative 0.9%. This is the sixteenth consecutive month of negative savings. But the good news is the savings rate for recent months has been revised upwards - so the U.S. consumer is in slightly better shape than previous thought.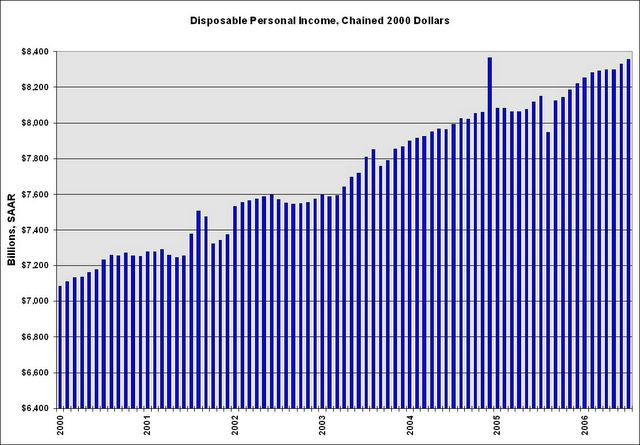 Back in July, Chairman Bernanke commented:
"... favorable fundamentals, including relatively low unemployment and rising disposable incomes, should provide support for consumer spending."In July I was concerned that real disposable personal income had stalled. This report, including the revision for June, shows that real DPI has been rising for the last two months.
Also personal consumption expenditures rose sharply in July, including spending for durable goods. Reports of the death of the American consumer are premature!
On jobs, there was more weakness in the Help Wanted Index
The number of help-wanted ads in U.S. newspapers fell in July, a private research group said on Thursday.knzn has been tracking the job indicators, including the Conference Board and the Monster Employment Index. Overall the job market appears to be weakening and the employment report tomorrow will be interesting. I think it will show the first significant decline in residential construction employment.
The Conference Board said its gauge measuring help-wanted ad volume in the United States was 32 in July, down from a revised 34 in June. The index was originally pegged at 33. It was 39 a year ago.
...
Online want-ad volume fell to about 2.33 million in July, from about 2.44 million in June, the Conference Board said. Online ads reached 2.35 million in May.
Best to All.
Wednesday, August 30, 2006
Retailer Watch
by Calculated Risk on 8/30/2006 08:24:00 PM
I've been looking for signs of a retail slowdown. Here is some more news today:
From MarketWatch: Ethan Allen sales slow in August
Ethan Allen Interiors Inc.'s chairman and chief executive Farooq Kathwari ... said sales have further slowed in August. In a statement, Kathwari said lower consumer confidence and the company's initiative to reduce lead time in filling customer orders has impacted the company's first quarter results. ...On July 27, the Danbury, Conn.-based maker and retailer of home furnishings and accessories said written business in past months had slowed from prior-year levels.From Reuters: Costco cuts forecast as discretionary spending slows
Costco ... warned of lower-than-expected quarterly profit because of disappointing margins, as customers cut back on purchases of big-ticket discretionary items such as furnitureOf course, there is this from the AP: Analysts See Solid August Retail Sales
...
The warning from the largest U.S. warehouse club operator took analysts by surprise because Costco's sales growth has been among the strongest in the retail sector in recent quarters.
...
"This could be an early sign that the higher-income consumer is finally starting to feel a bit of a pinch," said Anthony Chukumba, an analyst with Morningstar.
...
Lower-priced chains such as Wal-Mart Stores Inc. have been feeling ... pressure for more than a year because their lower-income customers are most sensitive to rising energy costs.
There are indications that the economic pain is moving up the income scale. Chukumba noted that housewares retailer Williams-Sonoma Inc. ... cut its profit forecast last week.
Back-to-school shoppers are expected to lift August same-store sales for a handful of retailers, though high energy prices and interest rates will have likely tempered overall retail sales.Overall the retail news isn't bad, and these warnings are not large misses. On Thursday, after the market closes, we will find out how the caffeine addicts (Starbucks) are holding up!
This year, August retail sales are also expected to benefit from tax-free holidays declared in 13 states aimed at helping back-to-school shoppers.
Dow Jones: Subprime mortgages see early defaults
by Calculated Risk on 8/30/2006 04:49:00 PM
Via the Contra Costa Times: Subprime mortgages see early defaults
More subprime borrowers are defaulting in the early months of their home loans ... in recent months, an increasing number of lenders catering to borrowers with weak credit have reported a sharp rise in delinquencies that had occurred as soon as six months after origination.So far no real surprise, but ...
Nationwide, about 3 1/2 subprime loans out of every 10,000 originated between January and June had a delinquency on their first monthly payment ... only one out of every 10,000 subprime loans granted last year had experienced missed payment in their first month. ...
"If those borrowers are finding themselves in trouble very early on, it may give lenders an indication that the underwriting criteria or quality control are not sufficiently tight," says Damien Weldon, director of collateral risk analytics at LoanPerformance. ...
Those early defaults have forced lenders such as NetBank Inc., Fremont General Corp. and H&R Block Inc. to buy back loans already sold to whole-loan acquirers, particularly Wall Street investment banks that pool and package those loans into asset-backed securities and then sell them to large investors such as insurance companies and hedge funds. The buybacks, in turn, have led lenders to incur losses and set aside more money in their reserve funds for potential loan repurchases in the future.These buybacks are interesting. I wonder how many loans these subprime lenders might be forced to buy back?
... H&R Block told investors ... "an increase in early payment delinquencies" and the resulting "higher level of repurchase requests from loan buyers" led it to increase its loan reserves. ...
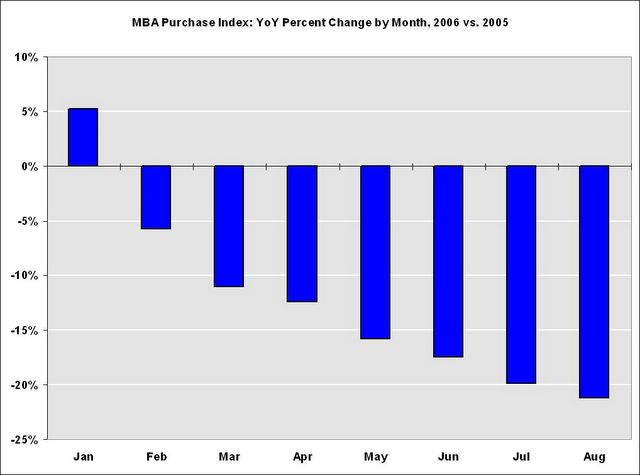
MBA: Mortgage Applications Decline
by Calculated Risk on 8/30/2006 12:18:00 AM
The Mortgage Bankers Association (MBA) reports: Mortgage Applications Decline
Click on graph for larger image.
The Market Composite Index, a measure of mortgage loan application volume, was 556.5, a decrease of 0.9 percent on a seasonally adjusted basis from 561.5 one week earlier. On an unadjusted basis, the Index decreased 2.3 percent compared with the previous week and was down 22.4 percent compared with the same week one year earlier.Mortgage rates increased slightly, after declining for the last several weeks:
The seasonally-adjusted Purchase Index decreased by 1.6 percent to 375.9 from 382.2 the previous week and the Refinance Index increased slightly to 1609.2 from 1608.5 one week earlier. The Purchase Index is at its lowest level since November 2003. emphasis added
The average contract interest rate for 30-year fixed-rate mortgages increased to 6.39 percent from 6.38 percent ...Change in mortgage applications from one year ago (from Dow Jones):
The average contract interest rate for one-year ARMs increased to 5.97 percent from 5.91 percent ...
| Total | -22.4% |
| Purchase | -19.2% |
| Refi | -26.4% |
| Fixed-Rate | -21.3% |
| ARM | -25.2% |
Purchase activity continues to fall and is at 2003 levels. August 2006 purchase activity is off 21.7% compared to August 2005. Year-to-date purchase activity is off 12.9% compared to 2005 and appears to be getting worse.
Interest rates on a 30 year mortgage have fallen from a peak of 6.86%, just two months ago, to 6.38% last week. This has helped boost refinance activity in recent weeks.

The refinance share of mortgage activity increased to 41.5 percent of total applications from 40.6 percent the previous week. The adjustable-rate mortgage (ARM) share of activity increased to 26.8 percent of total applications from 26.4 percent the previous week.It is possible that refinance activity will decline when the new Nontraditional Mortgage Guidance is released in the next couple of months.
Tuesday, August 29, 2006
Study: Housing Market Getting Worse
by Calculated Risk on 8/29/2006 04:17:00 PM
From the Dow Jones Newswire: August Home Data Weak
Sales and home prices fell at a faster clip than expected and inventories climbed further in August as the housing market continued to deteriorate, according to a Banc of America Real Estate Agent survey.
Nontraditional Mortgage Guidance: 60 Days
by Calculated Risk on 8/29/2006 11:57:00 AM
Matthew Swibel writes in Fortune on August 23rd: Dodging A Bullet
"A band of five government regulating agencies led by the Comptroller of the Currency, appear likely in the next 60 days or so to pour cold water on the hot--and lucrative--nontraditional mortgage loan market adored by banks and mortgage brokers. These include the popular, but deadly interest only and pay-option adjustable rate, in which borrowers decide each month how much to repay."Swibel told me that the OCC is "growing frustrated by delays caused by other agencies" and is pushing hard for the release of the guidance.
UPDATE: This paper was released today by the OCC. OCC Working Paper 2006-1, "Foreclosures of Subprime Mortgages in Chicago: Analyzing the Role of Predatory Lending Practices," by Morgan Rose.
This paper suggests passage of the Nontraditional Mortgage Guidance as a possible regulatory action to address rapidly rising foreclosures due to subprime lending:
"A ... candidate for action would be encouraging subprime lenders to review and tighten their lending practices to ensure that their borrowers, especially those seeking refinances, are not taking on more debt than they can handle given their other financial obligations, and that all information relevant to a potential borrower’s ability to repay a loan is considered before extending a loan. This approach is consistent with the recently proposed Interagency Guidance on Nontraditional Mortgage Products, which encourages prudent loan terms and underwriting standards rather than restricting particular loan features. ... this approach has the major benefits of addressing the key role that this paper’s findings indicate low- or no-documentation plays, and being less likely to cause unintended and undesired distortions in the subprime lending market."
Monday, August 28, 2006
America's Long-Term Fiscal Health
by Calculated Risk on 8/28/2006 03:17:00 PM
Over on Angry Bear, I disagree with former Senators Kerrey and Rudman: Just Say No.
Professor Samwick, a new and welcome addition to Angry Bear, agrees with me: First Things First
"... the appropriate target for the General Fund deficit is for it to average to zero over a business cycle. A corollary to that is that the General Fund should be in surplus during the non-recessionary parts of that business cycle. (A slightly weaker target that I would also accept is that the Debt/GDP ratio not trend upward over time.) This Administration seems to have no problem submitting budgets that don't conform to this target. Certainly the Congress doesn't aspire to a higher standard.
So as much as I would like to see the looming financial crises with entitlement programs averted, CR's requirement of the current leadership in the White House and the Capitol is a reasonable one to impose as a precondition for agreeing to a bipartisan effort to address what will be the most immediate budget issues in a decade or two."
 Click on graph for larger image.
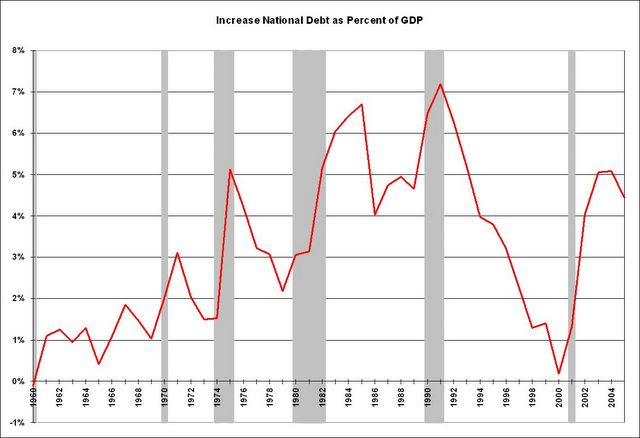
This graph shows the increase in the National Debt as a percentage of GDP since 1960. Recessions are shaded.
Note: Since the graph is based on annual numbers, recessions are approximate. Also, the graph uses the annual increase in the National Debt as a surrogate for the General Fund deficit.
Sometimes there were fiscal policy changes at the same time as the recession (like in '61, '81 and '01), but the cyclical increases in the deficit, related to recessions, are very clear.
If the U.S. economy slides into recession next year, the cyclical increase in the deficit, based on previous down cycles, will probably be on the order of 2% of GDP. Another 2% on top of the current 4% to 4.5% Bush structural deficit is close to 6.5% of GDP. And a 6.5% of GDP annual increase in the National Debt, for a $13.5 Trillion economy, is almost $900 Billion per year!
That is why resolving the Bush structural deficit is so important. If the Bush Administration is serious about improving America's long-term fiscal outlook, let them prove it by taking steps to reduce the structural deficit first, before addressing entitlements.
Bloomberg: Business Spending May Languish
by Calculated Risk on 8/28/2006 02:12:00 AM
Last month I asked: Will Business Investment Rescue the Economy? I was not sanguine.
Here are some further thoughts on business investment from this Bloomberg article: Business Spending May Languish, Raising Risk of U.S. Recession
Forecasts of a moderate slowdown for the U.S. economy this year assume that businesses will accelerate their spending on equipment, helping compensate for any weakening in consumer demand. ...Schwab sent me a recent forecast titled "Recession Watch". The piece made many of the same arguments, without the flair, of Nouriel Roubini.
"Most of the people forecasting a soft landing are counting on a boost from capital expenditures," says Liz Ann Sonders, chief investment strategist at Charles Schwab & Co. in New York. "I would be careful about that." She puts the odds of a recession at more than 50-50, "and it could happen relatively quickly."
"It makes little sense for businesses to accelerate their capital-spending plans at a time when final consumer demand, the largest source of demand, is decelerating," says Jan Hatzius, chief U.S. economist with Goldman Sachs in New York. "We have long been skeptical about the `handoff' concept."The article presents some optimitic views on business spending, and then returns to the theme:
New skeptics are being made too. Donald Straszheim, vice chairman of Roth Capital Partners LLC in Newport Beach, California, says he's reconsidered the prediction he made in December of a business spending binge.
"A business decision-maker would have to be blind not to see what's going on and be rethinking whether they ought to be a little more cautious over the next 24 months," says Straszheim.
Only 21 percent of the firms in the Federal Reserve Bank of Philadelphia's August survey said they expect to increase capital spending over the next six months, the lowest percentage since January 2003. ...And Paul Kasriel of Northern Trust asks the obvious question:
"Capital spending among small businesses is pretty flat," says William Dunkelberg, chief economist at NFIB. "There's nothing really exciting happening there, either in terms of buildings or software and equipment."
"If companies weren't on a spending boom earlier in the cycle, when consumer demand was soaring and their balance sheets were running over with cash, why would they suddenly go on a spending boom now?"This makes sense, and historically residential investment leads nonresidential investment - either up or down. And residential investment is clearly falling. So a business investment boom is possible, but I wouldn't bet on it.
Saturday, August 26, 2006
Residential Construction Layoffs
by Calculated Risk on 8/26/2006 09:42:00 PM
Today I heard, through a company insider, about significant layoffs at one of the major (top ten) homebuilders. I can't confirm the information, so I won't mention the company, but I have been expecting layoffs in the residential construction field to accelerate in the second half of 2006. Click on graph for larger image.
Note the scale doesn't start from zero: this is to better show the change in employment.
Currently there are 3.323 million people employed in residential construction in the U.S. according to the BLS. In July, the BLS reported that residential construction employment decreased by 9,000 jobs, and is now down about 37,000 jobs, a decrease of just over 1% from the peak in February.
If the current bust is similar to previous Residential Investment busts, reported residential construction employment might decrease by 800K to 1.3 Million over several years. That means residential construction employment might start falling by 30K per month or more, perhaps as soon as the August report.
This Press Enterprise article has some details on construction layoffs in California's Inland Empire: Construction hitting a wall
Inland home builders accustomed to years of unfettered growth are reassessing their expansion plans, slowing construction, discarding options to buy new land and trying to unload lots they already own.The hope is that these laid off workers will find other work.
...
Major public home builders have quietly begun to dismiss employees. Among the first to downsize in the Inland Empire was KB Home, which this year laid off 39 employees in the region, or about 10 percent of its staff.
"Virtually all the big builders are cutting back head count ... All are cutting costs and the easiest thing to cut unfortunately are people," said Stephen East, an analyst based in St. Louis specializing in public home builders for Susquehanna Financial Group LLP.
The cuts include field superintendents, office clerical workers and upper-level managers in land acquisition and entitlement, said Lee Terry, president of Lee Terry & Associates, an executive search firm for the home-building industry based in San Mateo.
...
Shea Homes recently let go five employees after lower sales projections led to elimination of a planned design center and the outsourcing of some other operations, said Bob Yoder, president of the Inland division of Shea Homes.
...
[Doug McAllister, Western Door's chief executive] said his company has dismissed less-experienced carpenters, and he plans to lay off about 20 percent of his 250 office, production and warehouse workers. He said to retain his best carpenters, he will reassign some to remodeling.
...
RSI Professional Builder Services in Chino ... [a] cabinet manufacturer ... let go 20 people, or about 10 percent of the company's work force, said Eric Vanderheyden, president and general manager.
"We are just scaling back our expectations," he said.
Unemployment in the Inland region is the lowest it has been in several decades, so those who lose jobs in real estate are likely to be rehired, said Inland economist John Husing.I believe Dr. Husing has it backwards; the Inland economy is strong because of residential construction. Therefore I suspect these workers will have a difficult time finding other jobs. And many jobs in housing related industries have non-transferable skills, require low levels of education, and are relatively well paying. So even if these laid off workers find new employment, they may have to take significant pay cuts.
For instance, construction workers no longer needed to build houses could build commercial buildings and public projects or become warehouse workers and truck drivers, he said.
"Anytime something happens like this there is a little pain. But we are better able to handle it than at any time in the 42 years since I have been studying the economy," Husing said.
The August employment report will be released next Friday, and might show the first significant impact of the housing bust on employment.
UPDATE: From Nouriel Roubini: Eight Market Spins About Housing by Perma-Bull Spin-Doctors...And the Reality of the Coming Ugliest Housing Bust Ever ...
And from The Observer: Paul Ashworth, chief US economist at Capital Economics suggests "The downturn in the US housing market will force businesses to slash 73,000 jobs a month in the new year". See The Observer: US housing slump fuels crash fears
Enough Gloom; A Touch of Grace
by Calculated Risk on 8/26/2006 04:38:00 PM
This is a short break from the economics posts.
I found this fan tribute to ... well ... long term readers can guess who.
Enjoy and have a great day!
Friday, August 25, 2006
Lower Growth Forecasts
by Calculated Risk on 8/25/2006 04:36:00 PM
A couple of related stories ...
Just a few months ago most analysts were still very positive on the U.S. economy through '07. Now economists are starting to revise down their growth estimates. As an example, from Globe and Mail: Higher odds of a hard landing
The end of the U.S. housing boom will trim consumer spending, slow economic growth and set the stage for a recession in corporate profits, according to a forecast from economists at National Bank Financial.And from the AP: Housing and fuel strain shoppers
"In light of the swift buildup of the inventory of unsold homes, it is only a matter of time before prices decline at the national level," Clément Gignac and Stéfane Marion wrote in a note.
"In our opinion, a deterioration of household net worth, at a time when the sum of the household energy bill and financial obligations has risen to a record share of disposable income, will force consumers to rebuild their savings rate."
The economists cut their U.S. 2007 economic growth target to 1.9 per cent from a 2.4 per cent projection in July-August, and lowered their expectations for personal consumption growth to 1.4 per cent from 2.3 per cent. They also raised the odds of a U.S. hard landing to 40 per cent from 25 per cent.
"This development will set the stage for a recession in U.S. profits," Mr. Gignac and Mr. Marion said.
Retailers and economists say many Americans are waiting to buy big-ticket items and cutting back on frills. Homeowners are shelving plans to remodel kitchens. Families are dining out less and tightening their budgets.The article mentions the sluggish sales at Lowe's, Wal-Mart and at several casual dininrestaurantsts. The AP article concludes with this frightening story:
"People are taking funds from one area and committing them to another, gasoline and utilities in particular," said Gregory Miller, chief economist at Sun Trust Bank Inc. He predicts growth in consumer spending will fall from a rate of 2.5 percent to around 1.5 percent during the second half of this year, bringing down overall economic growth at the same rate.
At the same time, homeowners are seeing a key source of their wealth lose value as housing prices fall in some parts of the country.
Psychologically, this creates the opposite of the "wealth effect" that kept upbeat consumers spending as stock prices rose in the late 1990s and real estate boomed after the recession in 2001, said Robert Weagley, chair of the personal financial planning department at the University of Missouri.
... After two strong years of sales, business has slowed dramatically this summer [says] David Richardson, the 50-year-old co-owner of Rothschild's Antiques and Home Furnishings in St. Louis.Many people will be surprised at how quickly market psychology can change. I'm reminded of something Stephen Robinett once wrote:
"Look around," Richardson said, gesturing to an empty store. "I'm scared. I don't know what's the right thing to do. Do you stand by the tried and true, or do you move on?"
"Speculative bubbles go on longer and end quicker than most people expect."
Thursday, August 24, 2006
Feldstein: Slow Growth, Not Recession
by Calculated Risk on 8/24/2006 10:05:00 PM
Bloomberg reports: Harvard's Feldstein Says U.S. Should Dodge Recession
The U.S. economy should dodge recession, said Harvard Professor Martin Feldstein, who heads the organization that dates business cycles.That is the positive outlook: slow growth, but no recession. Still, Feldstein is clearly concerned about the loss of simulus from the "Home ATM".
"If I had to make a likely guess, I would say slow growth, but not recession," Feldstein said ...
...
Feldstein, who chairs the National Bureau of Economic Research, said a recession could occur if households made a "decision to start saving again" rather than keep spending as the housing market fades. ...
"Household savings is now negative and that was driven by the fact that house wealth was up and that mortgage refinancing was very, very appealing," Feldstein said. "People took that money and they went and spent a lot of it. So if that goes into reverse, that could tip the economy."
Still, he noted a "lot of positives that could keep the economy moving along," among them a moderation in the trade deficit.
As chairman of Cambridge, Massachusetts-based NBER, Feldstein is a member of its Business Cycle Dating Committee.
For the pessimistic view, see Krugman: Housing Gets Ugly (pay). For excerpts see Economist's View.
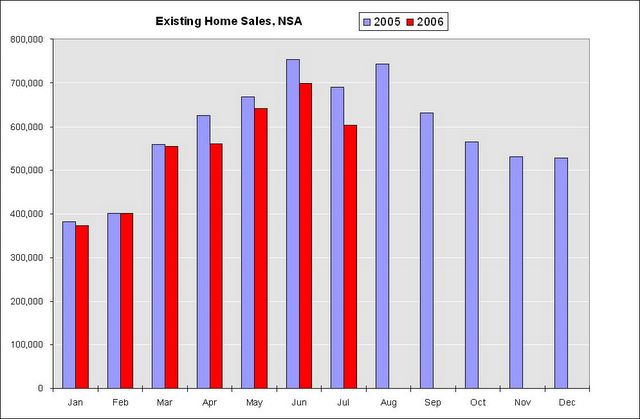
Housing: Difference a Year Makes
by Calculated Risk on 8/24/2006 07:19:00 PM
From MarketWatch: The difference a year makes
| The difference a year makes Recent data quantify housing cooldown (year-over-year changes). | |
| Builders’ sentiment |  52.2% 52.2% |
| New-home sales | 21.6% |
| Purchase-mortgage applications | 20.9% |
| Building permits | 20.8% |
| Housing starts | 13.3% |
| Existing-home sales | 11.2% |
| Existing-home inventories |  39.9% 39.9% |
| New-home inventories | 22.4% |
For builder sentiment, they are using the August numbers. For July, builder sentiment was off 44%. So the situation has probably gotten worse. Also, existing home sales lags most of the other indicators.
Update: New Home Sales and Recessions
by Calculated Risk on 8/24/2006 02:25:00 PM
 Click on graph for larger image.
Here are the updated graphs for New Home Sales vs. recessions, including the July data and revisions.
For an explanation of the 2nd graph, please see this discussion (figure 3): Investment and Recessions 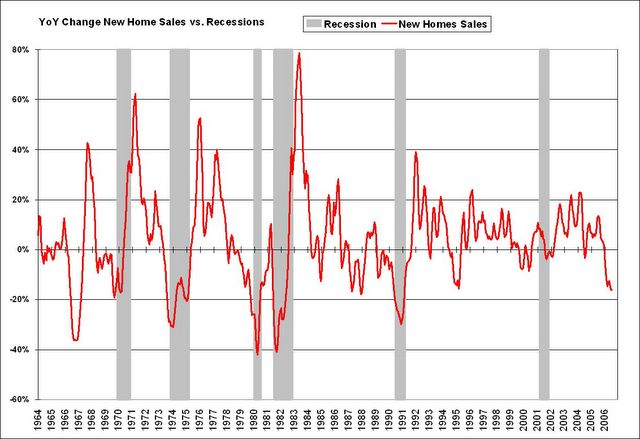
Although sales for July are down over 20% compared to July 2005, the YoY change is down 16% based on the smoothed three month centered average. This indicator is just above the minus 20% threshold.
For another look at New Home Sales data, see: New home sales continue to fall.
July New Home Sales: 1.072 Million Annual Rate
by Calculated Risk on 8/24/2006 10:31:00 AM
According to the Census Bureau report, New Home Sales in July were at a seasonally adjusted annual rate of 1.072 million. Sales for June were revised down to 1.120 million, from 1.131 million. Numbers for April and May were also revised down.
Click on Graph for larger image.
Sales of new one-family houses in July 2006 were at a seasonally adjusted annual rate of 1,072,000 ... This is 4.3 percent below the revised June rate of 1,120,000 and is 21.6 percent below the July 2005 estimate of 1,367,000.
The Not Seasonally Adjusted monthly rate was 91,000 New Homes sold. There were 117,000 New Homes sold in July 2005.
On a year over year NSA basis, July 2006 sales were 22.2% lower than July 2005. Also, July '06 sales were below July 2004 (96,000) and July 2003 (99,000) sales. This is the lowest July since 2002 when 82,000 new homes were sold.
The median and average sales prices were down slightly. Caution should be used when analyzing monthly price changes since prices are heavily revised.
The median sales price of new houses sold in July 2006 was $230,000; the average sales price was $293,500.
The seasonally adjusted estimate of new houses for sale at the end of July was 568,000. This represents a supply of 6.5 months at the current sales rate.
The 568,000 units of inventory is another record for new houses for sale.
On a months of supply basis, inventory is above the level of recent years.
This report is weaker than expected by Wall Street, but is in line with recent reports from home builders. More later today on New Home Sales and Recessions.
Wednesday, August 23, 2006
AutoNation chief warns of recession
by Calculated Risk on 8/23/2006 07:03:00 PM
The Orange Country Register reports: AutoNation chief warns of recession
The chief executive of the nation's largest auto-dealing company said Tuesday the economy is "at a tipping point," threatened with recession as rising interest rates undermine consumer confidence.
"The question is how bad a recession," said Mike Jackson, CEO of AutoNation, which owns 338 auto franchises, including House of Imports in Buena Park, Power Toyota Cerritos, Lexus Cerritos and Power Toyota Irvine.
During the first six months of this year, auto sales fell 0.3 percent nationwide and 6.8 percent in Orange County. Sales of autos and gasoline account for almost one-third of retail spending in Orange County...
 Click on photo for larger image.
TIPPING POINT: "Sales of pickup trucks are down because construction activity is backing off," says, Mike Jackson, CEO of AutoNation. "Pickups are the backbone of construction."
Photo: Jeff Kowalsky, Bloomberg
And from the AP: Slowing Pickup Truck Sales Hurt Profits
Much to the detriment of Detroit's Big Three, people like [carpenter Tom] Wright are delaying truck purchases, cutting into profits and forcing Ford Motor Co., General Motors Corp. and DaimlerChrysler AG's Chrysler Group to idle some assembly lines.This is a secondary effect from the housing bust; slower auto sales, especially slower truck sales as construction workers find less work.
Pickup sales overall are off 15.7 percent in the first seven months of the year from the same time last year.
Sales of Ford's F-series pickups, the highest-selling vehicles in the nation, are down 12.3 percent. The No. 2 seller, the Chevrolet Silverado, is off 20.1 percent as the company changes production to a new model. Dodge's Ram line is down 11.7 percent.
More from the Archetypical Eeyore
by Calculated Risk on 8/23/2006 02:06:00 PM
From Professor Duy: Fed Watch: Finally – Some FedSpeak
Last week Dallas Fed President Richard Fisher stepped up to the podium, but revealed little new in Fed thinking, simply noting the tight spot between accelerating inflation and slower growth. The only new information one could glean from his speech was when he described recession-minded analysts as “Eeyores.” Such a dismissive remark can only suggest that the idea of a rate cut is furthest from his mind. That said, Fisher’s “eighth inning” remark lingers in everyone’s minds – perhaps the best strategy is to bet against Fisher, and side with the “Eeyores.”
 What is an Eeyore? From Wikipedia:
 'Eeyore is a fictional character from the book series and cartoon Winnie-the-Pooh. ... He is a pessimistic, gloomy, old donkey who is a friend of Winnie the Pooh. Eeyore is hardly ever happy and when he is, he is still sardonic and a bit cynical.'And who is the archetypical Eeyore? More from Tim Duy:
To be sure, policymakers have an eye on the housing slowdown, but I just doubt they feel much urgency. Certainly, not as much urgency as the current archetypical Eeyore, Nouriel Roubini, whose recent writing leaves me thinking about liquidating all my assets and rebalancing into a “diversified” portfolio of dry goods, gold, guns, and ammunition (which in Oregon would not be considered out of the ordinary).Very funny! Duy's commentaries are always enlightening and frequently amusing.
And now from the archetypical eeyore himself, Professor Roubini writes: "The Biggest Slump in US Housing in the Last 40 Years"…or 53 Years?
"At this point there no doubt on whether the housing sector is contracting ... I have also argued before that the effects of housing on US economic growth and the role of housing in tipping the US economy into a recession in early 2007 are more significant than the role that the tech sector bust in 2000 played in tipping the economy into a recession in 2001."Read Nouriel's piece for his analysis, but here is his conclusion:
"... the simple conclusion from the analysis above is that this is indeed the biggest housing slump in the last four or five decades: every housing indictor is in free fall, including now housing prices. By itself this slump is enough to trigger a US recession: its effects on real residential investment, wealth and consumption, and employment will be more severe than the tech bust that triggered the 2001 recession. And on top of the housing bust, US consumers are facing oil above $70, the delayed effects of rising Fed Fund and long term rates, falling real wages, negative savings, high debt ratios and higher and higher debt servicing ratios. This is the tipping point for the US consumer and the effects will be ugly. Expect the great recession of 2007 to be much nastier, deeper and more protracted than the 2001 recession."Eeyore indeed. Did I mention Eeyore is also a very intelligent animal?
NAR: Existing-Home Sales Down With Softening Prices
by Calculated Risk on 8/23/2006 10:42:00 AM
The AP reports:
"Sales of previously owned homes plunged in July to the lowest level in 2 1/2 years and the inventory of unsold homes climbed to a new record high, fresh signs that the housing market has lost steam."The National Association of Realtors (NAR) reports: Existing-Home Sales Down With Softening Prices

Click on graph for larger image.
Existing-home sales were down in July, while home prices in many areas are slightly below year-ago levels, according to the National Association of Realtors®.
Total existing home sales – including single-family, townhomes, condominiums and co-ops – dropped 4.1 percent to a seasonally adjusted annual rate1 of 6.33 million units in July from a downwardly revised pace of 6.60 million June, and were 11.2 percent below the 7.13 million-unit level in July 2005.

David Lereah, NAR’s chief economist, said higher interest rates dampened sales but that price softening is good news for the housing market because it is drawing buyers. “Many potential home buyers have been on the sidelines, some ‘kicking the tires,’ but mostly waiting for sellers to compromise on prices and terms,” he said. “Now sellers in many areas of the country are pricing to reflect current market realities. As a result, there could be some lift to home sales, but it’ll likely take some months for price appreciation to rise.”
The national median existing-home price for all housing types was $230,000 in July, up 0.9 percent from July 2005 when the median was $228,000. The median is a typical market price where half of the homes sold for more and half sold for less.
Total housing inventory levels rose 3.2 percent at the end of July to 3.86 million existing homes available for sale, which represents a 7.3-month supply at the current sales pace.Existing Home Sales are a trailing indicator. The sales are reported at close of escrow, so July sales reflects agreements reached in May and June.
As I've noted before, usually 6 to 8 months of inventory starts causing pricing problem - and over 8 months a significant problem. With current inventory levels at 7.3 months of supply, inventories are now in the danger zone and prices are falling in many areas.
MBA: Mortgage Rates Decline
by Calculated Risk on 8/23/2006 12:22:00 AM
The Mortgage Bankers Association (MBA) reports: Mortgage Rates Decline
Click on graph for larger image.
The Market Composite Index, a measure of mortgage loan application volume, was 561.5, an increase of 0.1 percent on a seasonally adjusted basis from 561.2 one week earlier. On an unadjusted basis, the Index decreased 1.2 percent compared with the previous week and was down 25.1 percent compared with the same week one year earlier.Mortgage rates declined:
The seasonally-adjusted Purchase Index decreased by 1 percent to 382.2 from 385.9 the previous week and the Refinance Index increased by 1.3 percent to 1608.5 from 1587.5 one week earlier.
The average contract interest rate for 30-year fixed-rate mortgages decreased to 6.38 percent from 6.54 percent ...Change in mortgage applications from one year ago (from Dow Jones):
The average contract interest rate for one-year ARMs decreased to 5.91 percent from 5.97 percent ...
| Total | -25.1% |
| Purchase | -20.9% |
| Refi | -30.5% |
| Fixed-Rate | -23.3% |
| ARM | -29.5% |
 Purchase activity continues to fall and is about at 2003 levels. So far, August 2006 purchase activity is off 21.2% from August 2005.
Purchase activity was especially strong in the Summer and early Fall of 2005, and that makes the comparisons look ugly. Still, year-to-date purchase activity is off 12.7% compared to 2005 and appears to be getting worse.
Interest rates on a 30 year mortgage have fallen from a peak of 6.86%, just two months ago, to 6.38% last week. These declining rates have probably helped boost refinance activity.
Tuesday, August 22, 2006
Fed's Moskow: Inflation Risk Greater than Slow Growth
by Calculated Risk on 8/22/2006 01:39:00 PM
From Reuters: Fed's Moskow-More rate increases could be needed
This month's pause to the Federal Reserve's string of interest rate hikes was "constructive," but more rate increases could still be needed to cut inflation, Chicago Federal Reserve President Michael Moskow said on Tuesday.Here is Moskow's speech: U.S. Economic Outlook. Here are his comments on housing:
"The risk of inflation remaining too high is greater than the risk of growth being too low. Thus some additional firming of policy may yet be necessary to bring inflation back into the comfort zone within a reasonable period of time," Moskow said in remarks prepared for a speech to the McLean County Chamber of Commerce.
...
"We need to balance the benefits of gaining new information against the costs of waiting too long. If inflation stays stubbornly high while we wait to see the effects of earlier policy actions, inflation expectations could increase -- and that would be very costly," said Moskow.
Current levels of job creation -- while below Wall Street expectations of the past few months -- were roughly consistent with potential growth, and the jobs market is solid, he said.
"Higher energy prices, the slowing in housing markets, and other factors should push near-term growth a bit below potential for a short period. However, I don't see evidence of a more worrisome downshift in activity," he said.
Of course, there are some risks. One relates to housing. The orderly declines that we've been expecting could become more significant. Housing had been an area of strength for an extended period during this business cycle. The large increases in home values added an indirect boost to household spending growth by increasing homeowners' wealth.Did I read that right? House prices won't decline nationally, but if they do, the impact on consumer spending would be "modest". That is a fairly optimistic outlook!
Some analysts say that housing is overvalued and that prices are going to decline nationwide. To be sure, we currently are seeing a good deal of softening in housing markets, and home prices are increasing at a slower rate. Looking ahead, most forecasts for GDP growth factor in slow home price appreciation and marked declines in residential investment. But it seems unlikely that prices will actually decline for the nation overall. Housing markets are local in nature. Home prices have risen only modestly in Chicago, Bloomington, and most Midwestern cities; the largest increases have occurred in cities such as Miami, Phoenix, and Las Vegas. Even if there were large price declines in some cities, there probably would be little spillover to a more general drop in prices nationwide. And even if prices did decline nationally, history suggests that the impact on consumer spending would be modest and gradual.
NAHB: Builder Confidence in Condo Market Falls
by Calculated Risk on 8/22/2006 12:23:00 PM
The National Association of Homebuilders (NAHB) reports: Builder's Confidence in Condo Market Dips Again.
Builder confidence in the condominium housing market weakened significantly in the second quarter of 2006, as sales continued to retreat from the record-high levels seen last yearBut confidence in rental apartments is soaring.
...
"Investors and speculators had been a big factor driving sales and production at the height of the condo boom and they have been pulling out of the market," said NAHB Chief Economist David Seiders, "What we are currently seeing is a level of condo production that is probably more sustainable in the long run, although builders are worried that affordability has also become a factor for buyers, now that the overall economy appears to be slowing."
The component of the MCMI that tracks current condo supply conditions fell to an index value of 32.0, compared to a value of 61.3 during the second quarter of last year. It was the third time since NAHB began tracking this data that the for-sale index has fallen below 50. A rating of 50 generally indicates that the number of positive responses is about the same as the number of negative responses.
...
In a set of special questions for condo developers, 82 percent said they had noticed buyer resistance to current prices and, of these, more than one-fourth reported that they have reduced prices. The average price cut was 9 percent.
About three-fourths of the respondents said they are using non-price incentives to boost sales and limit cancellations. Two-thirds of those builders who reported using incentives are including optional items at no cost, a third are absorbing financing points, and two-thirds are paying closing costs or fees to bolster sales. Half the developers are using agents or brokers to help sell, up from about 20% a year ago.
"We are in the midst of a solid comeback on the rental apartment side of the multifamily housing market," said NAHB Chief Economist David Seiders, who noted that during the last three years, condos have made up a rising share of multifamily housing production.This rental demand is somewhat local. Apartment vacancy rates, at 9.6% nationwide, are near all time highs according to the Census Bureau. And the Homeowner vacancy rate is at 2.2% - an all time high.
"At the same time, thousands of existing rental units had been converted to for-sale units to meet what seemed an insatiable appetite for condos," said Seiders. "As a result, the supply of rental units is very tight at a time when the demand pendulum is swinging back to rentals," said Seiders.
Retailer Watch
by Calculated Risk on 8/22/2006 12:28:00 AM
The most immediate impacts from the housing slowdown, on the general economy, will be the loss of housing related jobs, and the slowing of personal consumption expenditures due to less equity extraction.
As of July, residential construction employment was only off about 1% from the most recent peak. And mortgage equity extraction (MEW) was apparently still strong in Q2.
But recently there have been signs of a retail slowdown. First with casual dining (a discretionary expense) and now with the major retailers:
From the WSJ: Lowe's Net Rises, but Outlook Is Cut, Dim View for Year Suggests Wider Toll of Energy Costs And Home-Price Slowdown
Lowe's Cos. cut its outlook for the year ... underscoring that the economic malaise created by high energy prices and flattening home prices is spreading to more retailers.
The nation's second-largest home-improvement retailer, after Home Depot Inc... said that sales at stores open at least a year -- a key retailing measure often called "same-store sales" -- rose just 3.3%, near the bottom of Lowe's 3% to 5% forecast. The 3.3% quarterly gain was the smallest since 2003. And Lowe's said the weakness could last through the first quarter of next year.
The weaker same-store sales trend "is primarily the macroeconomic" environment coupled with shifts in its quarterly calendar, which includes one less week among other changes, said Robert Niblock, Lowe's chairman and chief executive. "Consumers are taking a bit of a breather," he said.
Long a retailing standout, the warning by Lowe's of weaker-than-expected gains for the rest of the year comes as higher gasoline, electricity and consumer-borrowing costs continue to pinch spending. Last week, Wal-Mart Stores Inc. and Home Depot offered mixed outlooks as U.S. consumers held tighter to their pocketbooks.
Even retailers appealing to more-affluent customers are now reporting a damping effect on sales of everything from lattes to home décor.
Monday, August 21, 2006
"Jingle Mail" and More
by Calculated Risk on 8/21/2006 07:27:00 PM
Phrase of the day from Fleck: Jingle Mail.
Jingle Mail: where homeowners have mailed in the keys because they can't make the payments and no longer have any equity in their homes.However, with the new bankruptcy law, some homeowners will still owe money on their homes even after they mail in the keys.
That phrase was a prominent feature of the S&L bust and ensuing real-estate debacle in 1990-1991 -- and something we'll be hearing lots more about in the future.
From Roubini: Recent Macro Indicators Strongly Reinforce My Recession Call...
The macroeconomic indicators published in the last week or so have strongly reinforced my out-of-consensus view that the US economy will fall into a recession by early 2007: quite simply most of them are headed sharply south, consistent with a sharp deceleration in growth in H2 that will lead to a recession by 2007.And a much more positive view on housing from two Fed economists - The great turn-of-the-century housing boom, Jonas D. M. Fisher and Saad Quayyum. Here are their conclusions:
This article has attempted to explain two features of the turn of the twenty-first century U.S. economy: high levels of residential investment and homeownership rates. Our main findings are as follows. First, it appears that the housing boom has not been driven by unusually loose monetary policy. This is not to say the monetary policy has not been unusually loose, but that to the extent it has been loose, this is not what has been driving spending on housing. Second, the current levels of spending on new housing are largely explained by technology-driven wealth creation over the previousI'm amazed by their conclusion. The authors clearly understood that the surge in residential investment was related to new mortgage products, but I believe they missed that excessive leverage can be considered speculation.
decade. Third, changes in the demographic, income, educational, and regional structure of the population account for about one-half of the increase in homeownership. That is, without any other developments, the homeownership rate is likely to have gone up anyway, but not by as much as it has done. The last finding is that substitution away from rental housing made possible by developments in the mortgage market, such as subprime lending, could account for a significant fraction of the increase in residential investment and homeownership.
We view our findings as supporting the view that the current housing boom may be a temporary transition toward an era with higher homeownership rates in which spending is temporarily higher than historical norms but will eventually return to such norms. While we have so far mostly avoided discussing housing prices, our findings do suggest that to the extent that house prices have grown considerably in recent years, this is not due to unusually excessive speculation in the housing market, such as would occur in a bubble. Instead, our findings point toward the high prices being driven by fundamentals.
"... substitution away from rental housing made possible by developments in the mortgage market, such as subprime lending, could account for a significant fraction of the increase in residential investment and homeownership."This type of leveraged activity pulls demand from future periods.

Starting with the first diagram on the left, these leveraged financing programs shift the demand curve to the right (light red) and increase the price from P0 to P1. In the future, the demand will be shifted to the left and the future price will be Pf1.
If Pf1 is less than P1, and the homeowner cannot make the mortgage payment, then the homeowner might resort to "jingle mail", and the supply will increase further - and depress prices even more.
Sunday, August 20, 2006
Investment and Recessions
by Calculated Risk on 8/20/2006 11:49:00 PM
This post will try to explain my focus on residential investment, the usefulness of New Home Sales as a leading indicator, and the current situation.
Note: these graphs may appear cluttered, and for larger versions of each graph, see the links at the end of this post. Click on graph for larger image (see end of post for even larger images)
Figure 1 shows the change in real GDP and Private Fixed Investment over the preceding four quarters, shaded areas are recessions. (Source: BEA Table 1.1.1)
A couple of observations:
1) Since 1948, private fixed investment has fallen during every economic recession.
2) Private fixed investment has fallen 13 times since 1948, with only 10 recessions.
So what happened during the periods around 1951, 1967 and 1986 to keep the economy out of recession? These are the periods when private investment fell, but the economy didn't slide into recession. The answer is generally the same for all three periods: a surge in defense spending. The defense spending in the early '50s was due to the Korean war, in the mid '60s the Vietnam war, and in the mid '80s a general defense build-up helped offset a small decline in private investment. The mid '80s also saw a surge in MEW (mortgage equity withdrawal) that also contributed to GDP growth.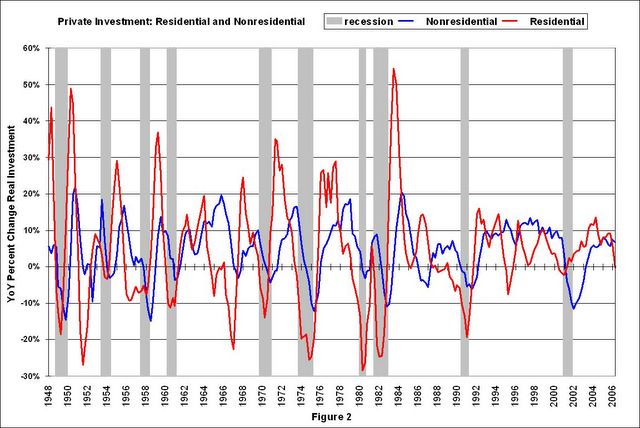 Figure 2 shows the separation of private fixed investment into residential and nonresidential components.
This graphs shows something very interesting: in general, residential investment leads nonresidential investment. There are periods when this observation doesn't hold - like '95 when residential investment fell and the growth of nonresidential investment remained strong.
Another interesting period was 2001 when nonresidential investment fell significantly more than residential investment. Obviously the fall in nonresidential investment was related to the bursting of the stock market bubble.
But the most useful information is that typically recessions are preceded by declines in residential investment. Maybe we can use that information.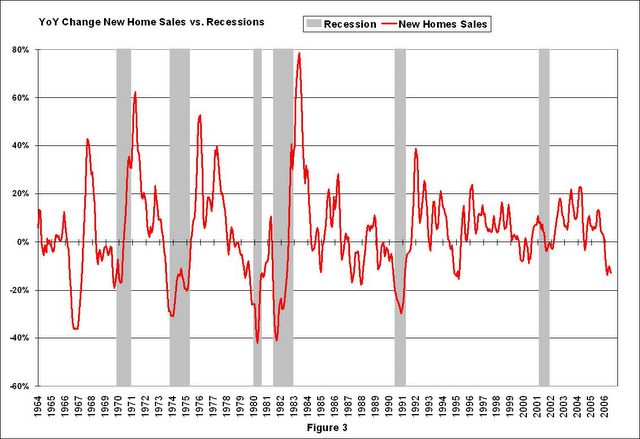
Figure 3 is the YoY change in New Home Sales from the Census Bureau.
Note: the New Home Sales data is smoothed using a three month centered average before calculating the YoY change. The Census Bureau data starts in 1963.
Some observations:
1) When the YoY change in New Home Sales falls about 20%, usually a recession will follow. The one exception for this data series was the mid '60s when the Vietnam buildup kept the economy out of recession.
2) It is also interesting to look at the '86/'87 and the mid '90s periods. New Home sales fell in both of these periods, although not quite 20%. As noted earlier, the mid '80s saw a surge in defense spending and MEW that more than offset the decline in New Home sales. In the mid '90s, nonresidential investment remained strong.
Conclusions:
1) New Home Sales appears to be an excellent leading indicator. However the series is heavily revised and that might limit it's usefulness. I believe the revisions problem can be mitigated using mortgage data from the MBA and builder sentiment from the NAHB to estimate New Home sales (this is for another post).
2) If New Home sales falls to around the 1.05 million level (20% decline), a recession is very likely.
What can offset the decline in New Home sales? Possibilities mentioned earlier are: a surge in defense spending, an increase in consumer borrowing especially MEW, and strong nonresidential investment spending.
An increase in consumer borrowing and MEW seems extremely remote, especially since household debt service is already at record levels. It is far more likely that MEW will fall over the next few years, also acting as a drag on GDP. (A future post will review the contribution from MEW to GDP over the last few years).
Most bullish analysts are forecasting strong nonresidential investment to offset the decrease in residential investment. Maybe. But usually nonresidential investment follows residential investment. Here is a previous post discussing nonresidential investment: Will Business Investment Rescue the Economy?
And defense spending has already increased significantly over the last few years. The implications of a further surge in defense spending, from the current levels, are too scary to contemplate.
NOTE: Click on the links below for 1200x800 graphs in new windows.
Figure 1: Private Fixed Investment vs. Recessions
Friday, August 18, 2006
Mortgage Insurance Companies letter to FDIC: Help!
by Calculated Risk on 8/18/2006 11:36:00 PM
This is the letter referenced in the previous post:Nontraditional Mortgage Guidance: "Within a Few Months"
Mortgage Insurance Companies of America Letter on Nontraditional Mortgage Guidance
I'm not familiar with the mortgage insurance business, but I wonder why the insurers don't just raise their rates for riskier mortgages? Here is the entire letter:
July 10, 2006
Hon. Sheila Bair
Chair
Federal Deposit Insurance Corporation
550 17th Street, N.W.
Washington, DC 20429
Hon. Ben S. Bernanke
Chairman
Board of Governors
Federal Reserve System
20th Street and Constitution Avenue, N.W.
Washington, DC 20551
Hon. Susan S. Bies
Governor
Board of Governors
Federal Reserve System
20th Street and Constitution Avenue, N.W.
Washington, DC 20551
Hon. John C. Dugan
Comptroller of the Currency
250 E Street, S.W.
Washington, DC 20219
Hon. John M. Reich
Director
Office of Thrift Supervision
1700 G Street, N.W.
Washington, DC 20552
Dear Sir or Madam:
The Mortgage Insurance Companies of America (MICA) has long been strongly supportive of the banking agencies' work to ensure appropriate prudential standards for mortgage risk. Mortgage insurers of course have all of their risk concentrated in this area, and we are deeply concerned about the potential contagion effect from poorly-underwritten or unsuitable mortgages and home-equity loans. We hope the agencies will soon finalize the draft guidance released last December on nontraditional mortgages [70 FR 77249], in part because the most recent market trends show alarming signs of ongoing undue risk-taking that puts both lenders and consumers at risk.
Below, I would like quickly to note some recent mortgage-market data that support the proposed guidance and argue for rapid action. MICA has been particularly concerned that the guidance make clear that loans with simultaneous second liens are risky in and of themselves, with these risks of course heightened when they are "layered" with other non-traditional features such as payment-option and interest-only structures. Key recent findings include:
• In June, Standard and Poors (S&P) decided to revise its ratings criteria for mortgages with simultaneous second liens, often called "piggyback" mortgages. (1) This decision brings the S&P rating into alignment with the more conservative one by Moody's and confirms the higher risks posed by these structures. S&P based its decision on research confirming that, holding credit scores equal, mortgages in which the borrower finances the down payment are more likely to default than loans with cash down payments. S&P also concluded that housing markets are likely to experience more stress than originally anticipated, heightening the risk for borrowers with no cash downpayment and, therefore, no equity in their homes.
• The most recent data available from a survey conducted by the National Association of Realtors (2) shows that first-time homeowners - 40% of all borrowers in 2005 - had an average down payment of only 2% on homes costing $150,000, but 43% of these homeowners had no down payment at all.
• In general, non-traditional mortgages have become a still more significant part of the market, despite the cautionary note in the proposed guidance. (3) First-quarter data indicate that interest-only and payment-option products now account for 2 6% of mortgage loan originations - a sharp increase from last year. (4) Even more striking, a recent Fitch report notes that 40-year mortgages with payment-option features now account for 8% of total securitized mortgage volume, up from 2% for all of last year. (5) Subprime mortgages with fixed rates for two years and variable ones for the following 38 years account for 8% of total subprime originations in the first quarter of 2006, up from 2% in all of 2005. (6) Fitch notes particular concern with loans like this because of "double-teaser" clauses.
MICA has noted that industry practice did not change as significantly as required following the final guidance in 2005 on home-equity loans. (7) Although the non-traditional guidance is now only in draft form, one would have expected a far slower growth in industry reliance on non-traditional products in anticipation of final standards with far-reaching market impact. The fact that this did not occur reinforces the suggestion in our earlier comment letter (8) that the final guidance be accompanied by clear language regarding not only consistent enforcement by the agencies, but also clear penalties for those who disregard it.
We would be pleased to provide additional background on the findings noted above or any other market analysis that would be of assistance as your agencies finalize the nontraditional mortgage guidance.
Sincerely,
Suzanne C. Hutchinson signature
Suzanne C. Hutchinson
1) S&P's Rating of Mortgage Pools Is Revised Amid Exotic Lending, Dow Jones Newswire, June 15, 2006.
2) Home Buyer and Seller Survey Shows Rising Use of Internet, Reliance on Agents, January 17, 2006 press release, National Association of Realtors.
3) See Inside Mortgage Finance, February 24, 2006, p.3-6. "Conventional Conforming Market Continued to Decline in 2005 as Nontraditional Mortgage Products Boomed." ARMs totaled $1.49 trillion in 2005 and that was about 47.8 percent of total mortgage originations in 2005. IO and option ARMs together totaled $575 billion of originations which comprised 38.6% of the total ARM business.
4) Inside Mortgage Finance, June 2, 2006, p.4-6, citing statistics from its affiliated publication Inside Alternative Mortgages that during the first quarter of 2006 TO loans and option ARMs "accounted for a hefty 26.4 percent of first quarter originations."
5) Fitch Ratings, "40-, 45-, and 50-Year Mortgages: Option ARMs, Hybrid ARMs, and FRMs," June 19, 2006.
6) Ibid.
7) Credit Risk Management Guidance for Home Equity Lending, Office of the Comptroller of the Currency, Board of Governors of the Federal Reserve System, Federal Deposit Insurance Corporation, Office of Thrift Supervision, and National Credit Union Administration, May 16, 2005.
8) March 29, 2006, Letter to FDIC
Nontraditional Mortgage Guidance: "Within a Few Months"
by Calculated Risk on 8/18/2006 11:18:00 PM
According to the Post:
Regulators say the final version of the rules will be announced within a few months.Excerpts from the WaPo: Insurers Urge Action On Risky Mortgages
Despite regulators' warnings that some popular types of mortgages are risky, lenders are still making them, and mortgage insurance companies have begun pleading with federal banking agencies to act quickly to restrict them.emphasis added
The loans under scrutiny include interest-only mortgages and "option" mortgages, in which borrowers decide each month how much to repay. Because monthly payments are lower than with traditional fixed-rate mortgages, borrowers can buy more expensive houses. In the past five years, millions of Americans have bought or refinanced homes using these loans. The risk comes because eventually these loans "reset," meaning the payment is adjusted upward -- sometimes as much as doubling -- to repay the full interest and principal owed.
"We are deeply concerned about the potential contagion effect from poorly underwritten or unsuitable mortgages and home equity loans," Suzanne C. Hutchinson, executive vice president of the Mortgage Insurance Companies of America, wrote in a recent letter to regulators. ". . . The most recent market trends show alarming signs of undue risk-taking that puts both lenders and consumers at risk."
Many borrowers are paying as little as possible. About 70 percent of the people who take out an option adjustable-rate mortgage, which lets the buyer avoid paying even the full interest on the loan, end up paying the lowest permissible amount each month, according to the Federal Deposit Insurance Corp., which regulates banks. The amount unpaid is added to the mortgage balance, so borrowers end up owing more than when they started. Having no equity in a home increases the risk of foreclosure, especially when housing values fall and houses are hard to sell.
...
In 2000, just 1 percent of American homeowners who got new loans had these types of loans, but by May 2005, about a third of all borrowers did -- about the same percentage as in May 2006, according to new data from First American LoanPerformance, which tracks the statistics.
Countrywide Home Loans Letter to Borrowers
by Calculated Risk on 8/18/2006 02:32:00 PM
Excerpt from the Baltimore Sun: Interest-only loans may start cheap, 'reset' scary
To head off potential problems, the largest mortgage originator in the United States, Countrywide Home Loans, quietly has begun sending out letters to thousands of borrowers who have been making only the minimum payments on the company's popular "PayOption" adjustable-rate mortgages.I'm trying to get a copy of the letter. If anyone has a copy, please send it to me. Thanks!
The letters explain that "this is an early message to alert you that, based on your current payment trends and potential future interest rate changes, the monthly payment you will be required to pay may increase significantly."
A model letter provided to me by Countrywide includes this hypothetical example of what could be ahead for a California homeowner currently making only minimum payments monthly on a $402,000 loan.
The current full interest rate on the loan is 7.6 percent, but the borrower has been paying just $1,348.47, far less than what's needed to fully amortize the mortgage over its 30-year term.
If the loan reset at today's rates, the letter explains, the full payment required would be $2,887.50 - more than double what the homeowner has gotten used to paying. Future reset rates could be even steeper, making the potential payment crunch much worse.
Dallas and the Housing Myth
by Calculated Risk on 8/18/2006 01:13:00 AM
One of the persistent myths is that the housing bust will be local, or only on the coasts. Some analysts have tried to determine "fair value" for various markets, like in this article: Coastal housing markets still way overvalued.
The article suggests housing prices in Dallas are actually 14% undervalued. Click on graph for larger image.
This graph shows nominal and real prices for Dallas (based on OFHEO) since 1987.
Obviously Dallas has not participated in the housing price boom of recent years. In fact real prices are 18% below 1986 prices!
Does that mean Dallas will not experience a housing bust?
It may surprised some people, but Dallas is already in the midst of a housing bust.
UPDATE: Apparently it would surprise Dallas Fed President Richard Fischer. From a speech on Wednesday (hat tip Mark Thoma):
The key area of concern in the real estate markets is the housing market. You know the facts here, so I’ll make this brief by repeating what a friend who has been a major homebuilder since 1973 recently told me: “This is the roughest, most sudden correction we have ever seen in the housing market.”Ahhh, if Texas is "resilient", imagine what will happen everywhere else! Back to orginal post:
It may comfort you to know that of all the markets in America, Texas’ is among the most resilient. In fact, so far this year, single-family permits are up 11 percent from their year-ago pace—the third fastest growth rate among the 50 states and a sharp contrast to the 7 percent year-to-date decline for the U.S. as a whole. Much of our state’s strength reflects the pro-growth climate and low land prices that Texas has to offer.
From the Dallas Morning News: Foreclosures soar in North Texas
Residential foreclosure postings are at record levels ...Prices probably will not fall as much in Dallas, as in Florida or California, but the large number of foreclosures will certainly put pressure on prices.
More than 3,800 houses are threatened with foreclosure next month in the Dallas-Fort Worth area. And for the first nine months of 2006, more than 28,000 home foreclosure postings have been recorded.
"This is bringing back nightmares of 1988 and 1989," when thousands of Texas homeowners lost their properties during a regional recession, said George Roddy, president of Addison-based Foreclosure Listing Service.
"The average number of postings in 1989 was about 2,000 a month," Mr. Roddy said. "And that is when we saw a massive devaluation of residential properties in some areas."
Housing analysts worry that if foreclosure rates stay at current levels, the overall housing market will suffer. This time, however, instead of a recession, poor financial planning and rising living expenses appear to be putting record numbers of North Texans out of their homes.
And notice Mr. Roddy's comment that 1989 saw "massive devaluation of residential properties", and yet the OFHEO series only shows a 13% nominal price drop for Dallas. That is key for housing. A seemingly small drop in prices will be have a significant economic impact and be perceived as "massive".
And finally, Dallas is not having a recession. Nor did Dallas see significant investor and second home buying. The Dallas bust is solely the result of excessive leverage and nontraditional mortgage products. And that should send a chill down the spines of every leveraged homeowner in the "bubble" states.
The housing bust will be nationwide.
Thursday, August 17, 2006
The Budget: Missing Money
by Calculated Risk on 8/17/2006 06:39:00 PM
Professor Chinn posts today: Are we winning the war against the budget deficit? Here is the August CBO report that he references: The Budget and Economic Outlook: An Update
I've posted many times on the difference between the Unified Budget and the General Fund (CBO lists as on-budget) Budget. Now for something different.
Long time readers know I like to track the annual increase in the National Debt. This is usually slightly larger than the General Fund deficit. As an example, for fiscal 2005:
Increase National Debt: $547 Billion.This is a typical gap ($54 Billion) between the two measures. However, for fiscal 2006:
General Fund deficit: $493 Billion.
Increase in National Debt to date: $551 Billion (1.5 months to go until fiscal year end).The non-Social Security off-budget expenditures have increased dramatically this year. My guess is the gap will be close to $160 Billion by the end of the fiscal year. Perhaps this is due to expenditure related to Hurricanes Katrina and Rita that might be off-budget. Or maybe this is a little Enron-style creative accounting.
CBO projected General Fund deficit: $437 Billion.
I don't know. But I'd like to know.
Good News: Initial Claims and Oil
by Calculated Risk on 8/17/2006 11:33:00 AM
Here is some good news. A few weeks ago, Bernanke expressed concern about initial claims rising:
"Gains in payroll employment in recent months have been smaller than their average of the past couple of years, and initial claims for unemployment insurance have edged up. These developments are consistent with the softening in the pace of overall economic activity that seems to be under way."I presented a graph of initial claims at that time.
 Click on graph for larger image.
Here is an updated graph of initial claims for unemployment insurance (four week average) including the Labor Department's report today.
Initial claims have been steady for the last couple of months.
And on oil: There was a brief increase in the spot price of oil to $78 per barrel, earlier this month, after BP announced a major Alaskan field shutting down. Since then, the news had improved and the price of crude oil has fallen almost ten percent: Good news triggers oil price fall
Oil prices have fallen to their lowest level in nearly two months as the continuing ceasefire in Lebanon and healthy US stockpiles calmed markets.Jobs are the key to achieving some sort of soft landing, so the trend in initial claims is definitely good to see. Unfortunately, I think the layoffs in housing related fields have just starting.
Traders said BP's decision to continue oil production from parts of its Prudhoe Bay field in Alaska had also triggered the price movement.
Brent crude was trading down 97 cents at $71.86 a barrel while US light, sweet crude slid $1.12 to $70.77.
Despite the drop, prices are still 14% higher for the year as a whole.
...
A series of positive developments in recent days have boosted sentiment, which had previously been hit by the conflict in Lebanon, kidnappings of foreign oil workers in Nigeria and BP's problems. The troubles had sent Brent prices to a record high above $78 a barrel.
Some of the factors and disruptions that helped drive us to very high levels have been resolved now
...
On Wednesday, the US energy department reported higher-than-expected oil inventories of 331 million barrels.
Stockpiles fell by 1.6 million barrels in the week ending 11 August but the reduction was less than expected given the closure of part of Prudhoe Bay, the largest oil field in the US, due to pipe corrosion.
Inventories remain at almost their highest level since 1999.
And falling oil prices are welcome news and will hopefully offset some of the impact from the housing bust. Two pieces of good news today.
Wednesday, August 16, 2006
Bay Area: Housing Sales at Ten Year Low
by Calculated Risk on 8/16/2006 02:33:00 PM
DataQuick reports: Bay Area home sales decline
Home sales in the Bay Area slowed to their lowest level in ten years as prices increased at their slowest pace since spring 2003, a real estate information service reported.And on prices
A total of 7,941 new and resale houses and condos were sold in the nine-county region last month. That was down 19.1 percent from 9,892 for June, and down 30.8 percent from 11,470 for July last year, according to DataQuick Information Systems.
Last month was the slowest July since 1996 when 7,682 homes were sold. The average July sales count since 1988 is 9,158.
The median price paid for a Bay Area home was $627,000 last month. That was down 2.6 percent from June's record $644,000, and up 3.5 percent from $606,000 for July a year ago. Last month's year-over- year increase was the lowest since May 2003 when the $427,000 median was up 3.4 percent.Note that prices in San Francisco, San Mateo and Marin are down slightly YoY. This is probably the beginning of price declines.
MBA: Refinance Applications Increase
by Calculated Risk on 8/16/2006 09:49:00 AM
The Mortgage Bankers Association (MBA) reports: Refinance Applications Increase 
Click on graph for larger image.
The Market Composite Index, a measure of mortgage loan application volume, was 561.2, an increase of 1.4 percent on a seasonally adjusted basis from 553.3 one week earlier. On an unadjusted basis, the Index increased 0.4 percent compared with the previous week but was down 25.6 percent compared with the same week one year earlier.Mortgage rates increased slightly:
The seasonally-adjusted Purchase Index decreased by 0.8 percent to 385.9 from 388.9 the previous week and the Refinance Index increased by 4.6 percent to 1587.5 from 1518.1 one week earlier.
The average contract interest rate for 30-year fixed-rate mortgages increased to 6.54 percent from 6.45 percent ...Change in mortgage applications from one year ago (from Dow Jones):
The average contract interest rate for one-year ARMs increased to 5.97 percent from 5.96 percent ...
| Total | -25.6% |
| Purchase | -21.9% |
| Refi | -30.5% |
| Fixed-Rate | -23.7% |
| ARM | -29.9% |
Purchase activity continues to fall, and has declined 21.9% compared to the same period last year.
Tuesday, August 15, 2006
Housing: Inverted Reasoning?
by Calculated Risk on 8/15/2006 04:25:00 PM
Housing will experience a soft landing, because the economy and job growth are strong. That appears to be the logic of certain pundits, and California's Inland Empire is an example of this New Millennium economy.
From local economist John Husing last month:
There's just too strong an economy and too much job growth for much other than the "soft landing" Husing and other economists have been predicting for the end of the five-year housing boom.And it's going to get even better as the Inland Empire Braces for Retail Boom:
"We are right on the cusp of a very powerful period in job growth," Husing said. "Local [Inland Empire, San Bernardino/Riverside area] unemployment in May was 4.2 percent, and that's the lowest I have seen for May in 42 years of studying the local economy.
...
"Is the housing market vulnerable?'' he asked. "Yes, it is. But is a bubble likely to happen? No, it is not. The underlying strength of our economy is too great.''
... inhabitants of the Inland Empire should hunker down for an unprecedented retail boom. ... that was the consensus at a panel ... at the first annual RealShare Inland Empire Conference, held [August 9, 2006].That is the optimistic view and many pundits have made the same argument for the entire U.S. economy too. On the other hand, is it possible that the Inland Empire economic boom has been driven by housing, and that the housing bust will start a downward vicious cycle?
First, here is some housing data released today by DataQuick: Southland home sales slowest in nine years; price gains lower.
Southland home sales downshifted last month to the slowest pace in nine years as the rate of appreciation fell to the lowest level since fall 1999, a real estate information service reported.Perhaps the Inland Empire immune to the housing slowdown. The following graphs are based on the DataQuick data. This is a comparison between Los Angeles and the Inland Empire (Riverside and San Bernardino) for the number of housing transactions and median house price.
...
Last month's sales total marked the lowest for a July since 1997, when 22,302 homes sold, and fell below the July average of 24,669 going back to 1988.

The first graph shows the monthly median home prices for Los Angeles, San Bernardino and Riverside since 2002.
Prices in the Inland Empire increased about the same as Los Angeles, and recently appear to have flattened out. Prices in both Riverside and San Bernardino are about 2% below their recent peaks.
 The second graph shows the year-on-year change in the median price for the three markets. YoY price appreciation is falling for all three markets.
 The third graph shows the YoY change in the number of transactions for each market.
There doesn't appear to be anything special about the Inland Empire when comparing the housing market to Los Angeles.
But when we look at employment, the Inland Empire stands out. For the U.S. economy, housing has been one of the main drivers of employment for the last few years. But no local economy has benefited more from the housing boom than the Inland Empire:
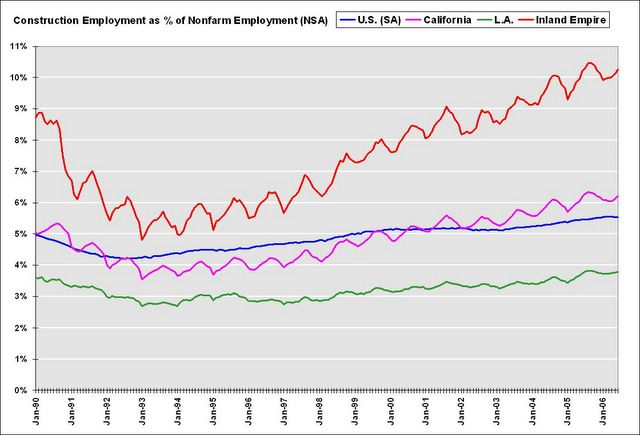
This graph compares construction employment, as a percent of total nonfarm employment, for the U.S., California, Los Angeles and the Inland Empire. Note: Construction includes non-residential construction.
Here is the hierarchy: Los Angeles has benefited less, in terms of employment, than most of California and the U.S. from the housing boom, California has benefited from the housing boom more than most of the U.S., and the Inland Empire is perhaps the greatest beneficiary.

So what happens during a housing bust? Just look at the unemployment rate in the previous bust.
The unemployment rate in California rose from 5.2% to 10.4% in just over two years. For the Inland Empire, the unemployment rate rose from 4.8% to double digits in the same period, peaking at 12.4%. Yes, California was impacted by Defense cutbacks in the early '90s, but the areas that were most dependent on housing saw the largest increases in the unemployment rate.
As the housing bubble unwinds, housing related employment will fall; and fall dramatically in areas like the Inland Empire. The more an area is dependent on housing, the larger the negative impact on the local economy will be.
So I think some pundits have it backwards: Instead of a strong local economy keeping housing afloat, I think the bursting housing bubble will significantly impact housing dependent local economies.


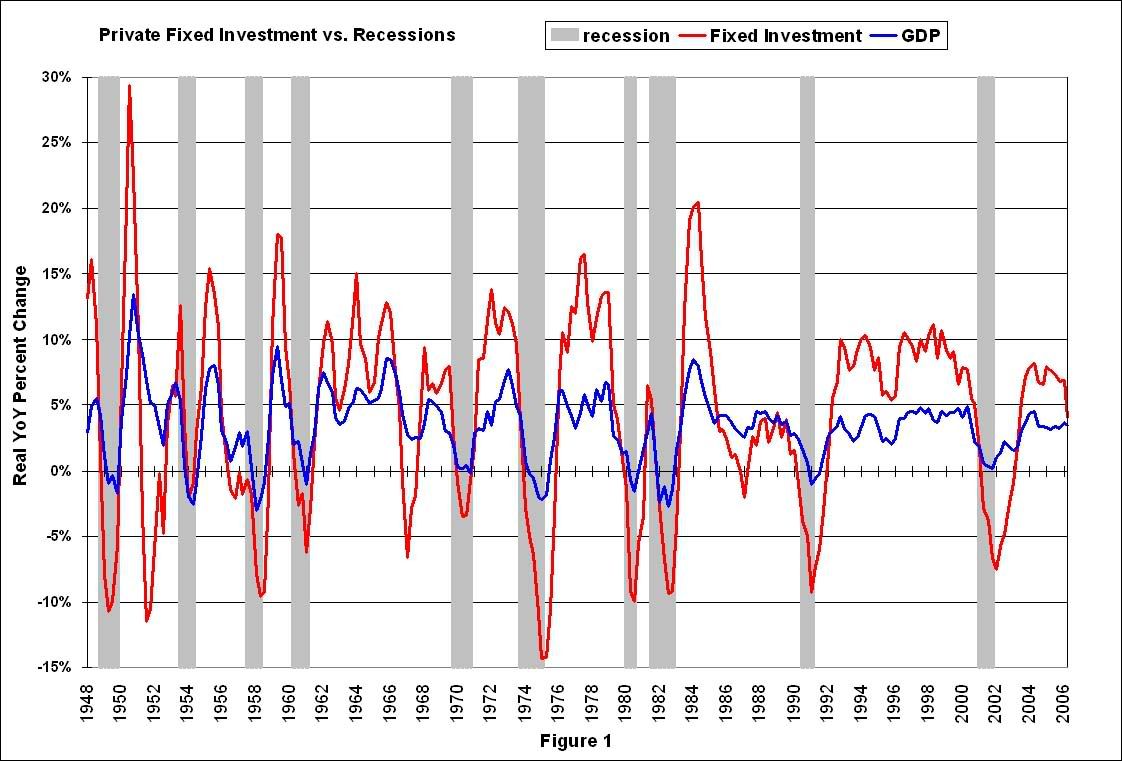
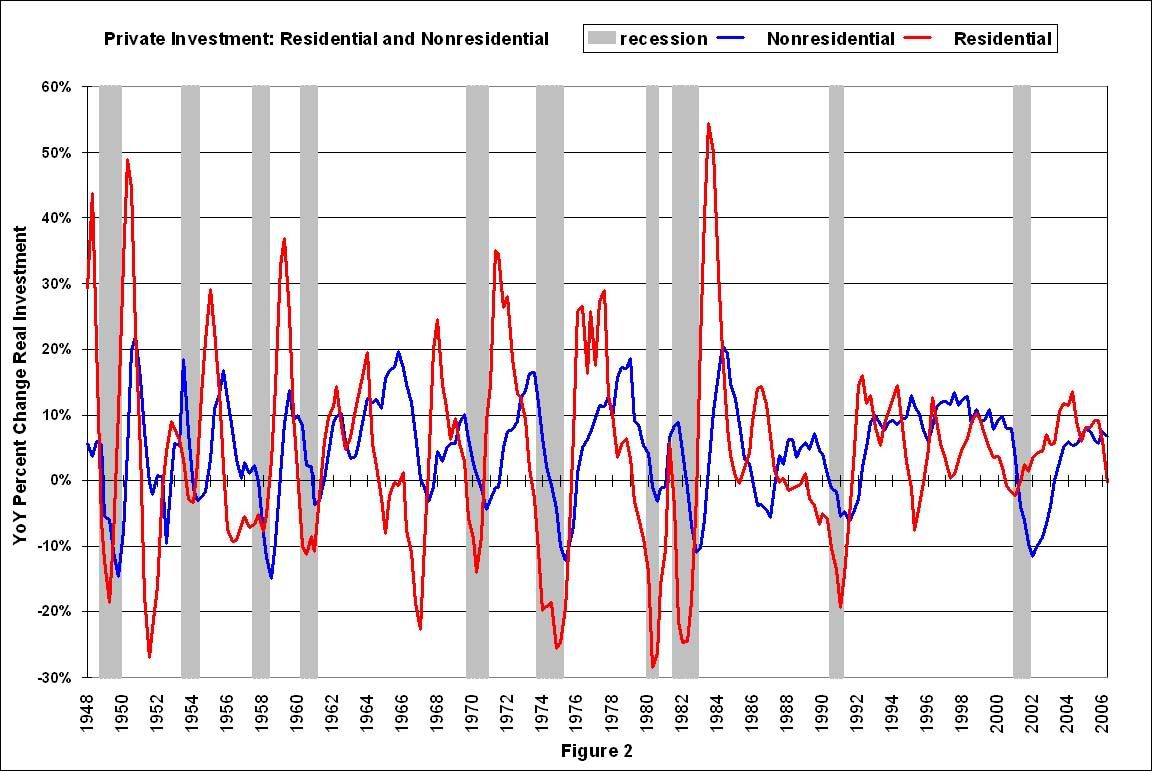
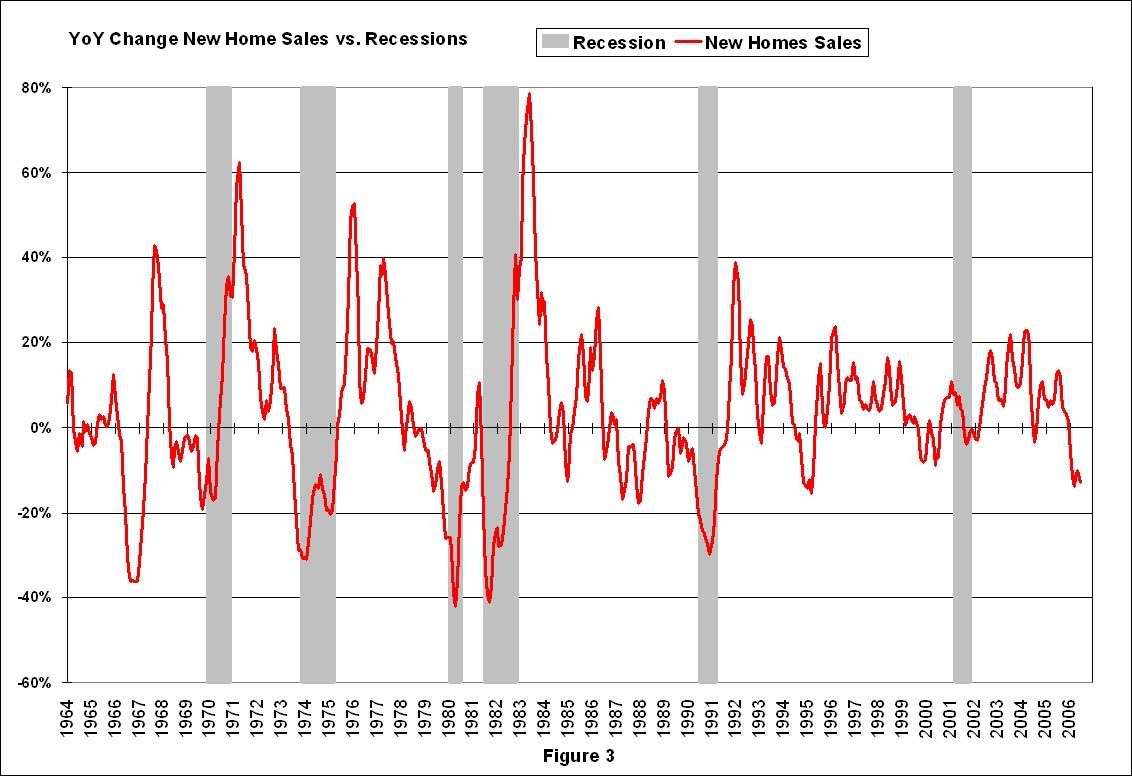