 RSS Feed
 by Calculated Risk on 4/07/2005 04:39:00 PM
Thursday, April 07, 2005
DOE: Short-Term Energy Outlook
The Department of Energy released their Short-Term Energy Outlook today. The DOE is now projecting monthly average gas prices to peak at about $2.35 per gallon in May. That probably means around $2.60 per gallon for regular unleaded in California.
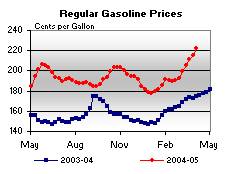
This graph from the DOE shows average US gas prices for the last 2 years.
The average U.S. price right now for regular grade gasoline is $2.22. California is $2.46. So the DOE is expecting approximately another $0.13 increase over the next 30 days.
For crude oil: WTI prices are projected to remain above $50 per barrel for the rest of 2005 and 2006.  The second graph (DOE slide 3) shops the DOE predictions. Bear in mind that every month, for almost a year, the DOE has projected oil prices to flatten or decrease, and every month prices have exceeded their base case expectations.
The high end of the DOE's projected range for the next two years (95% confidence) is $65 per barrel (WTI) and the low end is $45 per barrel.
Click on graph for larger image.
The third graph(DOE slide 4) shows the DOE's expected increase in World demand for crude oil in 2005 and 2006.
The DOE is expecting world oil demand to grow 2.7% in 2005 and 2.5% in 2006, compared to 3.3% in 2004. With worldwide demand at over 80 million bbd, a 2.7% increase would add 2.2 million bbd. So when OPEC announces they are adding 0.5 million bbd that is just a portion of the expected demand increase.
From a previous post on the oil situation: Both the supply and demand curves for oil are very steep. We all know this intuitively. If there is little unused capacity, it takes time for more oil production to become available since this involves huge capital intensive projects. And, in the short term, demand is fairly inelastic over a wide range of prices; for the most part people stay with their routines and keep their same vehicle. With two steep curves (supply and demand) we get the following: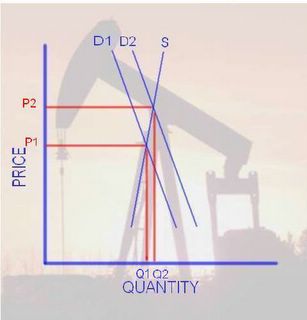
With a small increase in Demand (from D1 to D2), we see a small increase in Quantity (Q1 to Q2), but a large change in Price (from P1 to P2). Also a large price increase would occur if we had a small decrease in supply such as disruption to production, transport or refining (like hurricane Ivan in the GOM last year).
Of course the opposite is also true. A relatively small decrease in demand (or increase in supply) would cause a significant drop in price. If the DOE’s estimate of demand is correct, we will probably continue to see high energy prices.
No wonder the IMF warned today on the risk of a "permanent oil shock". From the FT article:
Raghuram Rajan, IMF chief economist, said: “We should expect to live with high oil prices.”Sorry for all the gloom and doom lately. At least the price of oil was off a little today.
“Oil prices will continue to present a serious risk to the global economy,” he added.
“The shock we see is a permanent shock that is going to continue... and countries need to adjust to that,” said David Robinson, deputy IMF chief economist.
UPDATE:
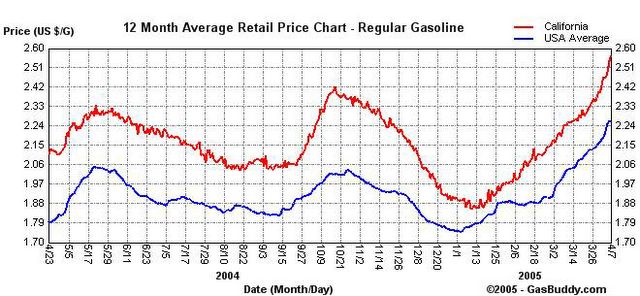
This graph shows the average price of regular unleaded in California and the US for the last 2 years. The graph is from GasBuddy. Give it a try for prices in your area (by state or city). Thanks to Jim Teter!
Note that the DOE prices were for April 4th ($2.22 for US, $2.46 for California). This graph shows that prices have climbed over the last 3 days, especially in California.
UPDATE 2:
Kash at Angry Bear has an interesting chart tracking economists' predictions, "Oil Prices and Recession".
Dave at Macroblog also has an interesting post "Energy Prices: Not The 1970s Redux (?)" on oil today.
With all this commentary, does that mean prices have peaked?


