by Calculated Risk on 5/09/2008 11:30:00 AM
Friday, May 09, 2008
March Trade Deficit
The Census Bureau reported a goods and services deficit of $58.2 billion for March 2008. Exports, in March, decreased $2.6 billion to $148.5 billion, but are up almost 16% year-over-year. Imports decreased by over $6 billion to $206.7 billion, and excluding petroleum, are up only 4% year-over-year.
So ignoring monthly fluctuations, the story remains the same: exports are surging and imports (ex-petroleum) have slowed. A few years ago the story was how the ports could increase import capacity. Now the problem is finding enough containers for exports - see from the WSJ: Container Shortage Frustrates U.S. Exporters Click on graph for larger image.
The red line is the trade deficit excluding petroleum products. (Blue is the total deficit, and black is the petroleum deficit). The current probable recession is marked on the graph.
Unfortunately the dollar amount of petroleum imports is surging, and this increase in petroleum imports (because of price, not quantity) is mostly offsetting the improvement in the non-petroleum trade deficit.
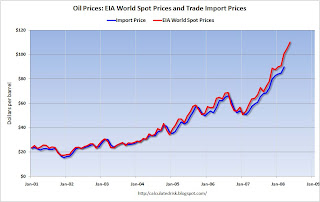
And the petroleum deficit will worsen in April and May. The second graph compares petroleum import prices with the EIA World Spot Price. This shows that import prices in April and May will be significantly higher than for March. Note that the May prices are for last week - and oil prices are setting new records again
 every day every hour!


