 RSS Feed
 by Calculated Risk on 12/27/2006 12:07:00 PM
Wednesday, December 27, 2006
More on November New Home Sales
Please see the previous post: November New Home Sales Click on graph for larger image.
One of the most reliable economic leading indicators is New Home Sales.
New Home sales were falling prior to every recession of the last 35 years, with the exception of the business investment led recession of 2001. This should raise concerns about a possible consumer led recession in the months ahead.
Some more optimistic observers will argue that sales have fallen back to a sustainable level after the excesses of 2004 and 2005. Others will argue that sales have to fall more in coming years, to make up for the excesses of recent years. That is one of the reasons 2007 will be such an interesting year.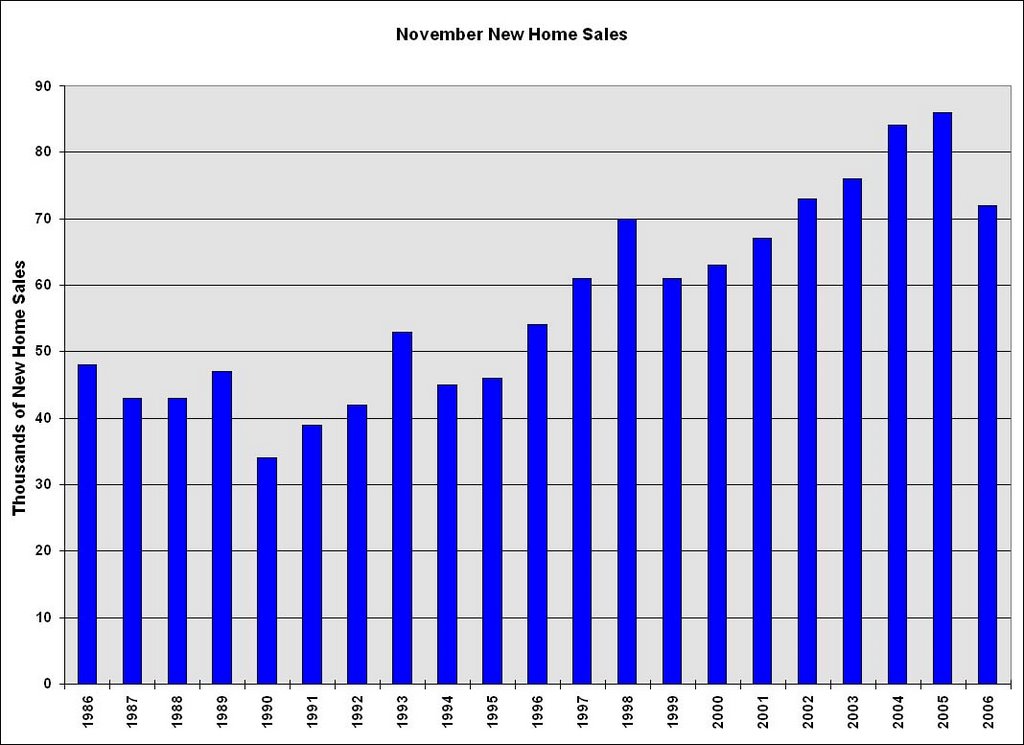
The second graph shows November New Home sales for the last 20 years. The recent sharp drop in sales is similar to the decrease at the start of the 1990s housing bust.
Also note that November sales have fallen below the 2002 levels.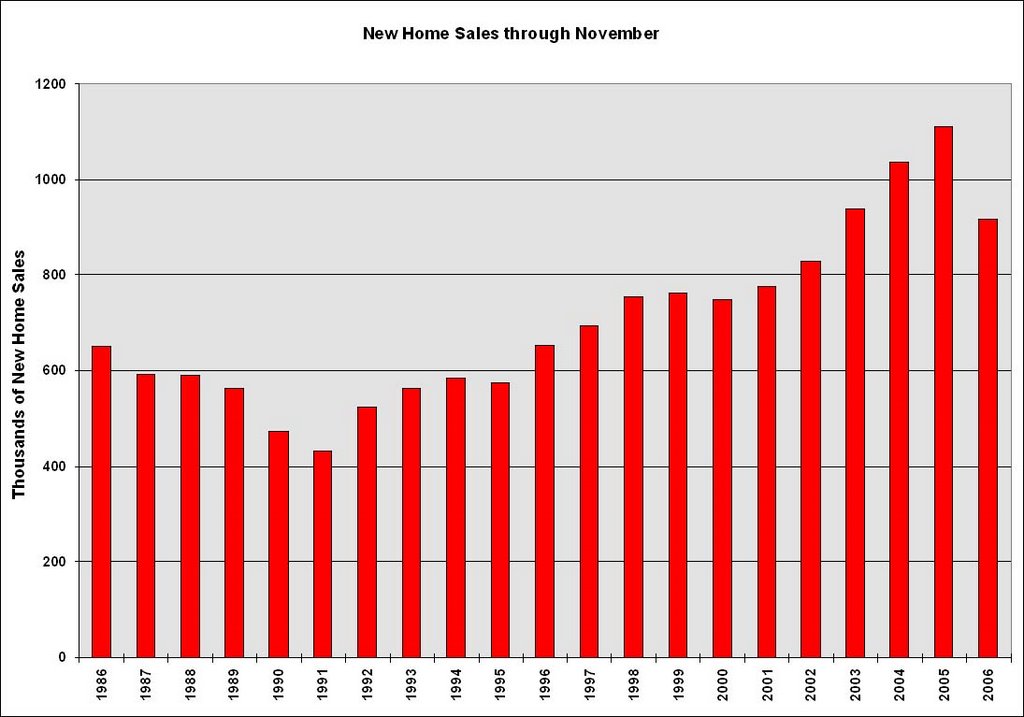
The third graph shows YTD New Home sales through November. It now appears that 2006 will finish as the 4th best year behind 2003.
Sales for the most recent months have fallen to the 2002 level. Fannie Mae is currently estimating that sales for 2007 and 2008 will be at the 2002 level (about 975K units). I think sales will fall further, perhaps to the level of the 1998 through 2001 period, or about 900K units in 2007.


