 RSS Feed
 by Calculated Risk on 2/28/2005 07:52:00 PM
Monday, February 28, 2005
New Home Sales as Leading Indicator
The Census Bureau announced today that New Home Sales "in January 2005 were at a seasonally adjusted annual rate of 1,106,000" and that "is 9.2 percent below the revised December rate of 1,218,000 and is 4.2 percent below the January 2004 estimate of 1,155,000". Although this decrease could just be normal monthly fluctuations, the volume of New Home Sales is very important to watch over a several month period. Below are several graphs showing the value of watching New Home Sales as a leading indicator for the economy.
There are three main numbers released each month: New Home Sales (Census Bureau), Construction Permits (Census Bureau) and Existing Home Sales (National Association of Realtors). The most important one to watch is New Home Sales. These are reported in the month that the buyer signs the contract, whereas existing home sales are reported at the close of escrow, usually 30 to 60 after the purchase agreement is signed. Permits are inexpensive and are therefore not predictive since they are not indicative of a builder's commitment to a project.
Here is a graph of the last two years of seasonally adjusted New Home Sales volume (Source: Census Bureau)
NOTE: Click on Graph for larger image.
Source: Census Bureau
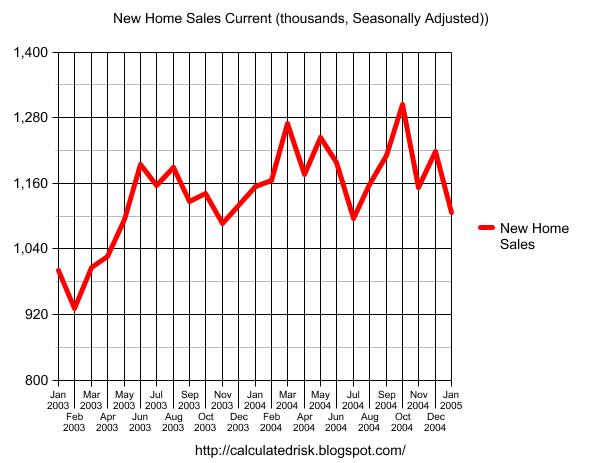

It appears that a peak may have occurred last October, but it could also be another head fake (like last March). A few more months of declining sales would be concerning.
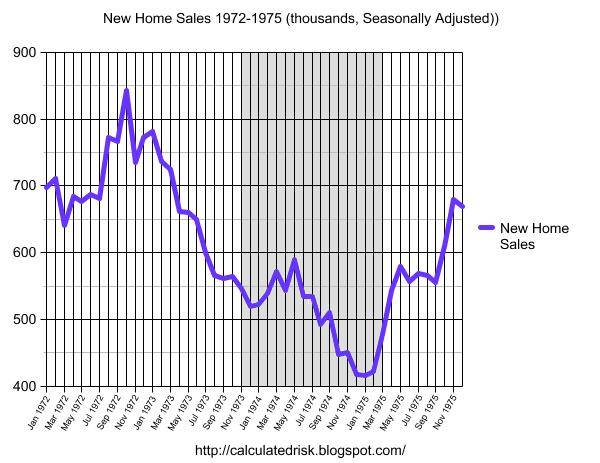
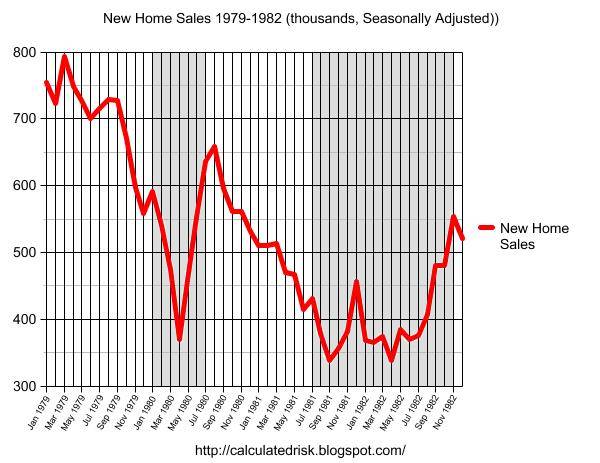
The following are the last three consumer recessions (four counting the '80s double dip). The gray area signifies that the economy was in recession based on the National Bureau of Economic Research's cycle dates. In each of these recessions New Home Sales were falling for 8 to 12 months prior to the onset of the recession. This holds true for the double dip recession of the early '80s; both dips were preceded by significant declines in sales volume.
Source: Census Bureau
Souce: Census Bureau
Source: Census Bureau
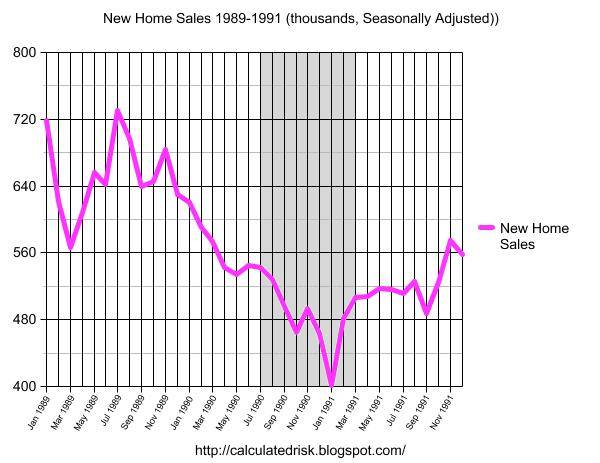
As an aside: Some observers might assume that mortgage interest rates were increasing while housing volumes were declining. This was not true for the '91 recession - mortgage rates were declining from a high of 11% in '89 to under 9% in '91. (See FreddieMac's Mortgage Summary)
If the peak for this housing cycle was in October, then we might see a housing related economic slowdown (even possibly a recession) starting in the 2nd half of 2005. However it also depends on the steepness of the decline. To be concerning volumes would need to drop 20% to 25% or more over a 6 to 8 month period.
We need to see several more months of sales declines, and seasonal volume under one million units, before we start to worry.


