 RSS Feed
 by Calculated Risk on 6/12/2010 01:15:00 PM
Showing posts with label MEW. Show all posts
Showing posts with label MEW. Show all posts
Saturday, June 12, 2010
Q1 2010: Mortgage Equity Withdrawal strongly Negative
Note: This is not Mortgage Equity Withdrawal (MEW) data from the Fed. The last MEW data from Fed economist Dr. Kennedy was for Q4 2008. My thanks to Jim Kennedy and the other Fed contributors for the previous MEW updates. For those interested in the last Kennedy data, here is a post, and the spreadsheet from the Fed is available here.
The following data is calculated from the Fed's Flow of Funds data and the BEA supplement data on single family structure investment. This is an aggregate number, and is a combination of homeowners extracting equity (hence the name "MEW", but there is very little MEW right now!), normal principal payments and debt cancellation. Click on graph for larger image in new window.
For Q1 2010, the Net Equity Extraction was a record low of minus $122 billion, or a negative 4.4% of Disposable Personal Income (DPI). This is not seasonally adjusted.
This graph shows the net equity extraction, or mortgage equity withdrawal (MEW), results, using the Flow of Funds (and BEA data) compared to the Kennedy-Greenspan method.
The Fed's Flow of Funds report showed that the amount of mortgage debt outstanding declined sharply in Q1, and this was probably mostly because of debt cancellation per foreclosure sales, and some from modifications, and partially due to homeowners paying down their mortgages as opposed to borrowing more. Note: most homeowners pay down their principal a little each month unless they have an IO or Neg AM loan, so with no new borrowing, equity extraction would always be slightly negative.
Mark Whitehouse at the WSJ argues: Default, Not Thrift, Pares U.S. Debt
The falling debt burden conjures up images of a nation seeking to repent after a decade of profligacy, conscientiously paying down mortgages and credit-card balances. That may be true in some cases, but it’s not the norm. In fact, people are making much more progress in shedding their debts by defaulting on mortgages and reneging on credit cards.I think that is correct - most of the decline in mortgage debt outstanding is probably because of debt cancellations via foreclosures, short sales, and some modifications.
Thursday, March 11, 2010
Q4 2009: Mortgage Equity Withdrawal Strongly Negative
by Calculated Risk on 3/11/2010 02:32:00 PM
Note: This is not Mortgage Equity Withdrawal (MEW) data from the Fed. The last MEW data from Fed economist Dr. Kennedy was for Q4 2008. My thanks to Jim Kennedy and the other Fed contributors for the previous MEW updates. For those interested in the last Kennedy data, here is a post, and the spreadsheet from the Fed is available here.
The following data is calculated from the Fed's Flow of Funds data and the BEA supplement data on single family structure investment. This is an aggregate number, and is a combination of homeowners extracting equity (hence the name "MEW", but there is very little MEW right now!), normal principal payments and debt cancellation. Click on graph for larger image in new window.
For Q4 2009, the Net Equity Extraction was minus $75 billion, or negative 2.7% of Disposable Personal Income (DPI). This is not seasonally adjusted.
This graph shows the net equity extraction, or mortgage equity withdrawal (MEW), results, using the Flow of Funds (and BEA data) compared to the Kennedy-Greenspan method.
The Fed's Flow of Funds report showed that the amount of mortgage debt outstanding declined in Q4, and this was partially because of debt cancellation per foreclosure sales, and some from modifications, and partially due to homeowners paying down their mortgages as opposed to borrowing more. Note: most homeowners pay down their principal a little each month unless they have an IO or Neg AM loan, so with no new borrowing, equity extraction would always be negative.
Equity extraction was very important in increasing consumer spending during the housing bubble and I don't expect the Home ATM to be reopened any time soon. So any significant increase in consumer spending will come from income growth or a lower saving rate, not borrowing.
Sunday, February 07, 2010
Harney: "Cash-in" Refis
by Calculated Risk on 2/07/2010 08:37:00 AM
From Kenneth Harney in the LA Times: 'Cash-in' refis growing in popularity
In Freddie Mac's latest quarterly survey of refinancings, 33% of homeowners put cash into the deal to lower their mortgage balances, the highest percentage ever. By contrast, only 27% of refinancers took cash out -- the lowest percentage on record.Harney discusses two reasons for "cash-in" refis: 1) Paying down the mortgage can get the borrower a better loan and avoid PMI, and 2) with interest rates so low on money market funds and CDs, paying down the mortgage offers a higher return.
... there has been a steady rise since the fourth quarter of 2007, when cash-ins hit 9%, up from just 5% of all refis earlier that year.
By early 2009, they accounted for 13% of refinancings, then grew to 18% in the third quarter. After that, cash-ins jumped to 33% in the final three months of 2009.
This "cash-in" has shown up in the Fed's Flow of Funds data.
 Click on graph for larger image in new window.
This graph shows the net equity extraction, or mortgage equity withdrawal (MEW), results, using the Flow of Funds (and BEA data) compared to the Kennedy-Greenspan method.
For Q3 2009, the Net Equity Extraction was minus $91 billion, or negative 3.3% of Disposable Personal Income (DPI). Q4 data will be released on March 11th.
This decline was partially because of debt cancellation per foreclosure sales, and some from modifications, like Wells Fargo's principal reduction program, and partially due to homeowners paying down their mortgages as opposed to borrowing more.
Maybe "mortgage burning parties" will make a comeback too.
Note: Mortgage burning link is to an audio of NPR story last year: Mortgage-Burning Parties Almost Extinct
Friday, December 11, 2009
Q3 2009: Mortgage Equity Extraction Strongly Negative
by Calculated Risk on 12/11/2009 11:30:00 AM
Note: This is not MEW data from the Fed. The last MEW data from Fed economist Dr. Kennedy was for Q4 2008. My thanks to Jim Kennedy and the other Fed contributors for the previous MEW updates. For those interested in the last Kennedy data, here is a post, and the spreadsheet from the Fed is available here.
The following data is calculated from the Fed's Flow of Funds data and the BEA supplement data on single family structure investment. Click on graph for larger image in new window.
For Q3 2009, the Net Equity Extraction was minus $91 billion, or negative 3.3% of Disposable Personal Income (DPI). This is not seasonally adjusted.
This graph shows the net equity extraction, or mortgage equity withdrawal (MEW), results, using the Flow of Funds (and BEA data) compared to the Kennedy-Greenspan method.
The Fed's Flow of Funds report showed that the amount of mortgage debt outstanding declined in Q3, and this was partially because of debt cancellation per foreclosure sales, and some from modifications, like Wells Fargo's principal reduction program, and partially due to homeowners paying down their mortgages as opposed to borrowing more. Note: most homeowners pay down their principal a little each month unless they have an IO or Neg AM loan, so with no new borrowing, equity extraction would always be negative.
Equity extraction was very important in increasing consumer spending during the housing bubble (some disagree with this, but I think they are wrong). Atif Mian and Amir Sufi of the University of Chicago Booth School of Business wrote a piece earlier this year: Guest Contribution: Housing Bubble Fueled Consumer Spending
Findings in our research suggest ... the rise in house prices from 2002 to 2006 was a main driver of economic growth during this time period, and the subsequent collapse of house prices is likely a main contributor to the historic consumption decline over the past year.Don't expect the Home ATM to be reopened any time soon - so any significant increase in consumer spending will come from income growth, not borrowing.
Tuesday, September 22, 2009
Q2 2009: Mortgage Equity Extraction Strongly Negative
by Calculated Risk on 9/22/2009 01:14:00 PM
Note: This is not data from the Fed. The last MEW data from Fed economist Dr. Kennedy was for Q4 2008. My thanks to Jim Kennedy and the other contributors for the pervious MEW updates. For those interested in the last Kennedy data, here is a post, and the spreadsheet from the Fed is available here.
The following data is calculated from the Fed's Flow of Funds data and the BEA supplement data on single family structure investment. Click on graph for larger image in new window.
For Q2 2009, the Net Equity Extraction was minus $48 billion, or negative 1.8% of Disposable Personal Income (DPI).
This graph shows the net equity extraction, or mortgage equity withdrawal (MEW), results, using the Flow of Funds (and BEA data) compared to the Kennedy-Greenspan method.
The Fed's Flow of Funds report shows the amount of mortgage debt outstanding is declining, and this is partially because of debt cancellation per foreclosure sales (and a little from modifications), and partially due to homeowners paying down their mortgages (as opposed to borrowing more). Note: most homeowners pay down their principal a little each month (unless they have an IO or Neg AM loan), so with no new borrowing, equity extraction would always be negative.
Clearly the Home ATM has now been closed for a few quarters.
Thursday, September 10, 2009
MEW and the Wealth Effect
by Calculated Risk on 9/10/2009 02:50:00 PM
Professors Atif Mian and Amir Sufi (both University of Chicago Booth School of Business and NBER) published a new paper: The Household Leverage-Driven Recession of 2007 to 2009 This is related to their paper earlier this year: House Prices, Home Equity-Based Borrowing, and the U.S. Household Leverage Crisis, See: MEW, Consumption and Personal Saving Rate
A cross-sectional analysis of U.S. counties shows that areas with modest increases in leverage from 2002 to 2006 have experienced only a minor economic downturn, whereas counties with large increases in household leverage from 2002 to 2006 have experienced a severe recession. Our findings suggest that the process of household de-leveraging is likely to be the major headwind facing the economy going forward.The authors have written a brief discussion of the paper at NPR Money: Lessons From The Fall: Household Debt Got Us Into This Mess
The Economist has a recent review of the paper: Withdrawal symptoms
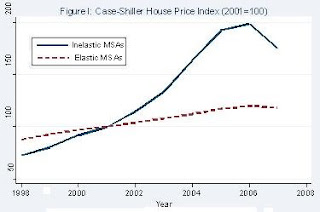
More than a third of new defaults in 2006-08 were because of home-equity-based borrowing. Default rates for low credit-quality homeowners rose by more than 12 percentage points in places where housing was scarcest and prices had risen most. In “elastic” cities, by contrast, the increase was less than four percentage points. This suggests huge over-borrowing. Prospects for a sustained recovery look dim if households that are most inclined to spend are mired in negative equity.Here are three graphs from the paper (posted with permission from the author):
 Click on graph for larger image.
The first graph is figure 5B from the paper. Looking at the left panel, note that the x-axis is the change in debt to income, by County, from 2002 to 2006. And the y-axis is for the period 2006 - 2008. This shows that the change in the debt to income ratio was a good predictor of default rates.
From the authors:
Correlation across Counties of Default Rates and House Prices during Recession with Leverage Growth from 2002 t0 2006
The left panel presents the correlation across U.S. counties of the increase in the household debt to income ratio from 2002 to 2006 and the increase in the default rate from 2006 to 2008. The right panel presents the correlation across U.S. counties of the increase in the household debt to income ratio from 2002 to 2006 and the decline in house prices from 2006 to 2008. The sample includes 450 counties with at least 50,000 households as of 2000.
 The second graph is figure 6A from the paper. From the authors:
 Auto Sales and Unemployment Rates in High and Low Leverage Growth Counties
High leverage growth counties are defined to be the top 10% of counties by the increase in the debt to income ratio from 2002 to 2006. Low leverage growth counties are in the bottom 10% on the same measure. The left panel plots the growth in auto sales for high and low leverage growth counties since 2005, and the right panel plots the change in the unemployment rate in high and low leverage growth counties since 2005. Auto sales decline and unemployment increases by significantly more in counties that experience the sharpest increase in debt to income ratios from 2002 to 2006.
 The third graph is figure 6B from the paper. From the authors:
 Correlation across Counties of Auto Sales and Unemployment during Recession with Leverage Growth from 2002 to 2006This analysis, comparing high and low leverage counties, is very revealing and shows that the high leverage areas are also the hardest hit (not surprising to those of us who felt mortgage equity extraction was a significant driver of consumption growth). The authors conclude:
The left panel presents the correlation across U.S. counties of the increase in the household debt to income ratio from 2002 to 2006 and the decline in auto sales from 2006 to 2008. The right panel presents the correlation across U.S. counties of the increase in the household debt to income ratio from 2002 to 2006 and the increase in unemployment rates from 2006 to 2008. The sample includes 450 counties with at least 50,000 households as of 2000.
[T]he initial economic slowdown was a direct result of an over-leveraged household sector unable to keep pace with its debt obligations.
Tuesday, July 28, 2009
Study: Using Home ATM Led to Most Foreclosures in SoCal
by Calculated Risk on 7/28/2009 07:30:00 PM
Nick Timiraos at the WSJ writes: Study Finds Underwater Borrowers Drowned Themselves with Refinancings (ht Jack)
Why are so many homeowners underwater on their mortgages?Here is the study: Follow the Money: A Close Look at Recent Southern California Foreclosures
...
Michael LaCour-Little, a finance professor at California State University at Fullerton, looked at 4,000 foreclosures in Southern California from 2006-08. He found that, at least in Southern California, borrowers who defaulted on their mortgages didn’t purchase their homes at the top of the market. Instead, the average acquisition was made in 2002 and many homes lost to foreclosure were bought in the 1990s. More than half of all borrowers who lost their homes had already refinanced at least once, and four out of five had a second mortgage.
The conventional wisdom is that households who purchased at the top of the market during the recent housing bubble are those most at risk of default due to recent price declines, upward re-sets of adjustable rate mortgage instruments, the economic downturn, and other factors. Here we use public record data to study Southern California borrowers facing foreclosure in late 2006 and 2007. We estimate property values at the time of the scheduled foreclosure sale with the automated valuation model of a major financial institution and then track actual sales prices for those properties that actually sold, either at auction or as later as REO. We find that virtually all of the borrowers had taken large amounts of equity out of the property through refinancing and/or junior lien borrowing with total cash extracted exceeding $300 million. As a result, losses to lenders exceed those of borrowers by a substantial margin, calling into question policies aimed at protecting borrowers.It may seem unfair that these homeowners receive help from the bank (or from the government), but as far as slowing foreclosures it really doesn't matter why the homeowner is underwater. I think the research from the Boston Fed suggesting the costs of foreclosure are less than the costs of modifications is a stronger argument against many mods.
emphasis added
Friday, July 03, 2009
U.K.: Britons Pay Down Mortgage Debt in Q1
by Calculated Risk on 7/03/2009 01:38:00 PM
From the Telegraph: UK homeowners pay back a record £8.1bn of mortgage debt
Britons injected £8.1bn to pay off their mortgage debt in the first three months of 2009, the Bank of England said on Friday ... The figure compares with a £7.7bn injection in the final three months of 2008 ...This is the fourth consecutive quarter with homeowners reducing their mortgage debt in the U.K..
"Sharply falling house prices have made housing equity withdrawal increasingly unattractive, while very tight credit conditions have made it more difficult to carry out the process as well as to take out new mortgages," said Howard Archer, chief UK economist at IHS Global Insight.
"In addition, ever lower savings rates have made it increasingly more attractive for many people to use any spare funds that they have to reduce their mortgages," he added.
The following is from the Bank of England: Housing Equity Withdrawal (HEW) Q1 2009
HEW occurs when lending secured on housing increases by more than investment in the housing stocks. Investment comprises new houses, home improvements, transfers of houses between sectors, and house moving costs, such as stamp duty and legal fees (although these fees do not add to the value of the housing stock, they are measured as investment, so reduce the funds available for consumption). So HEW measures mortgage lending that is available for consumption or for investment in financial assets (or to pay off debt).
 |
Thursday, June 25, 2009
WSJ Real Time Economics: Housing Bubble and Consumer Spending
by Calculated Risk on 6/25/2009 11:00:00 AM
Earlier this week, Charles W. Calomiris, Stanley D. Longhofer and William Miles wrote in Real Time Economics that the wealth effect from housing on consumption should be small. Atif Mian and Amir Sufi of the University of Chicago Booth School of Business respond that their data indicate the opposite.I commented on the Calomiris et. al. piece here: The Housing Wealth Effect? and I noted that Mian and Sufi disagreed.
Here are excerpts from Atif Mian and Amir Sufi's piece today:
... In the June 22nd entry for Real Time Economics, Calomiris, Longhofer, and Miles argue that ... “the reaction of consumption to housing wealth changes is probably very small.”
Findings in our research suggest the exact opposite: the rise in house prices from 2002 to 2006 was a main driver of economic growth during this time period, and the subsequent collapse of house prices is likely a main contributor to the historic consumption decline over the past year.
We agree with two key points made by Calomiris, Longhofer, and Miles. First, from the perspective of economic theory, it is not obvious that housing wealth should affect consumption. Second, it is difficult to measure the causal effect of housing wealth on consumption because other economic factors confound the relation. ...
These factors highlight the importance of quality data and sound methodology to estimate the effect of house prices on real economic activity. Our study samples 70,000 consumers in 1998 who were already homeowners at the time. We then follow the borrowing decisions of these households for eleven years until the end of 2008. Our data set represents a major advantage over prior studies; it allows us to see exactly how existing homeowners respond to increases in house prices.
In order to isolate the effect of house prices on consumption, we rely on a simple insight: in response to an equivalent increase in local housing demand, house prices will increase more in cities where, due to geography based factors, the cost of building a house is high. For example, consider a homeowner living in San Francisco and a homeowner living in Atlanta as of 1998. From 2002 to 2006, house prices rose sharply in San Francisco where it is difficult to build additional houses because of the limited geography. In contrast, in Atlanta, where home construction is cheaper, house price growth was moderate. In economics jargon, cities where housing supply is relatively “inelastic” will experience larger movement in house prices relative to “elastic” cities (see Figure I).
Our experimental design exploits this insight in order to test how house prices affect borrowing behavior. The “treatment” group consists of homeowners in inelastic housing supply cities (e.g., San Francisco) that experienced a sharp increase and subsequent collapse of house prices. The “control” group consists of homeowners in elastic housing supply cities (e.g., Atlanta) that experienced little change in house prices.
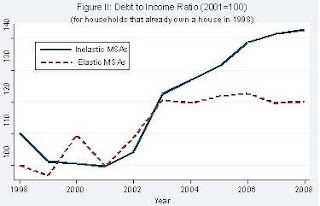
Using this methodology, we find striking results: from 2002 to 2006, homeowners borrowed $0.25 to $0.30 for every $1 increase in their home equity. Our microeconomic estimates suggest a large macroeconomic impact: withdrawals of home equity by households accounted for 2.3% of GDP each year from 2002 to 2006. Figure II illustrates the sharp increase in household leverage for homeowners living in inelastic cities.
A concern with our interpretation is that there are inherently different economic conditions in inelastic versus elastic housing supply cities that may have been responsible for the borrowing patterns we observe. However, several facts suggest that this is not a valid concern. First, inelastic cities do not experience a stronger income growth shock (i.e., a larger shock to their “permanent income”) during the housing boom. Second, the increase in debt among homeowners in high house price growth areas is concentrated in mortgage and home equity related debt.The results of Atif Mian and Amir Sufi fit with what I've observed.
Third, renters in inelastic areas did not experience a larger growth in their total debt. Finally, the effect of house prices on homeowner borrowing is isolated to homeowners with low credit scores and high credit card utilization rates. These “credit-constrained” households respond aggressively to house price growth, whereas the highest credit quality borrowers do not respond at all.
Our results demonstrate that homeowners in high house price areas borrowed heavily against the rise in home equity from 2002 to 2006. We also provide evidence that real outlays were a likely use of borrowed funds. Money withdrawn from home equity was not used to buy new homes, buy investment properties, or invest in financial assets. In fact, homeowners did not even use home equity withdrawals to pay down expensive credit card debt! These facts suggest that consumption and home improvement were the most likely use of borrowed funds, which is consistent with Federal Reserve survey evidence suggesting home equity extraction is used for real outlays.
...
Our analysis of the microeconomic data has led us to the conclusion that the severity of this economic downturn is rooted in the household leverage crisis, which in turn is closely related to the housing market. If the housing market continues to deteriorate, then further de-leveraging of the household sector will likely keep a lid on any rebound in consumption. In other words, the future of consumption and house prices are closely linked.
Monday, June 22, 2009
The Housing Wealth Effect?
by Calculated Risk on 6/22/2009 09:39:00 AM
Here we go again on this hotly debated topic: How much do changes in house prices impact consumption?
Charles W. Calomiris of Columbia University, Stanley D. Longhofer of the Barton School of Business and William Miles of Wichita State University argue at the WSJ Real Time Economics blog that the wealth effect of housing has been overstated: The (Mythical?) Housing Wealth Effect
...[M]any still fear that lower home values will depress consumer spending. This “wealth effect,” a drop in home values that causes consumers to cut back on purchases, is thought to dampen economic growth and hamper any recovery.I haven't read their paper (update: I have a copy).
At first glance, it seems reasonable to expect such a wealth effect. If consumers are less wealthy because of declines in the value of the assets they own, whether they be stocks or their homes — it seems logical that they would cut back on their spending. Indeed, many prominent economists have conducted research purporting to find large housing wealth effects, and often argue that the wealth effect from homes exceeds that from equities. Moreover, the Federal Reserve employs a model, which presumably guides its policies, that assumes the housing wealth effect is large.
A more careful look at the data, guided by economic theory, however, suggests that much of this evidence has been misinterpreted and that the reaction of consumption to housing wealth changes is probably very small. ... an increase in house prices raises the value of the typical homeowner’s asset, but such a price increase is also an equivalent increase in the cost of providing oneself housing consumption. In the aggregate, changes in house prices will have offsetting effects on value gain and costs of housing services, and leave nothing left over to spend on non-housing consumption.
Up to this point, we have neglected the question of whether housing wealth change affects consumption through another, indirect channel — a financing channel — by affecting consumers’ access to credit.
[CR note: this is MEW or the Home ATM]
... Some observers point to the latest housing boom, and the increased use of HELOCS and other mortgages during the boom, as evidence that housing prices spurred consumption through this financing channel. While this indirect financing channel is a theoretical possibility, it is an empirical question whether it is significant in its effect, and even if the indirect financial effect is present it should not produce a “first-order” effect of housing wealth on consumption; housing wealth should still matter much less for consumption than other forms of wealth.
... We put the data through numerous robustness checks, and found in most model specifications housing wealth had zero effect on consumption. In those few cases where housing wealth did have an impact on consumer spending, the impact was always smaller in magnitude than that from stock wealth, contrary to Case, Quigley and Shiller’s findings. We conclude that the impact of housing wealth on consumption, if it exists at all, is much smaller than popularly feared.
There are two parts here: 1) how do changes in house prices affect consumption, and 2) how does access to the Home ATM effect consumption. On the second point, I think the answer is MEW had a significant impact on consumption ... I frequently heard from auto, RV, boat, motorcycle, and home accessory retailers that their customers were borrowing from their homes during the boom to buy these products. All of these areas have seen sharp declines in consumption as MEW had declined.
This severe decline in consumption was easy to predict - and it happened. Meanwhile these authors dismiss it as simply "a theoretical possibility".
However, on the key point, I think most of the decline in consumption related to declining MEW is behind us.
Here is a recent paper on Mortgage Equity Withdrawal (MEW): House Prices, Home Equity-Based Borrowing, and the U.S. Household Leverage Crisis by Atif Mian and Amir Sufi (both University of Chicago Booth School of Business and NBER) (ht Jan Hatzius)
From the authors abstract (the entire paper is available at the link):
Using individual-level data on homeowner debt and defaults from 1997 to 2008, we show that borrowing against the increase in home equity by existing homeowners is responsible for a significant fraction of both the sharp rise in U.S. household leverage from 2002 to 2006 and the increase in defaults from 2006 to 2008. Employing land topology-based housing supply elasticity as an instrument for house price growth, we estimate that the average homeowner extracts 25 to 30 cents for every dollar increase in home equity. Money extracted from increased home equity is not used to purchase new real estate or pay down high credit card debt, which suggests that consumption is a likely use of borrowed funds. Home equity-based borrowing is stronger for younger households, households with low credit scores, and households with high initial credit card utilization rates. Homeowners in high house price appreciation areas experience a relative decline in default rates from 2002 to 2006 as they borrow heavily against their home equity, but experience very high default rates from 2006 to 2008. Our estimates suggest that home equity based borrowing is equal to 2.3% of GDP every year from 2002 to 2006, and accounts for over 20% of new defaults in the last two years.A couple of key points:
emphasis added
And here are the Kennedy-Greenspan estimates (NSA - not seasonally adjusted) of home equity extraction through Q4 2008, provided by Jim Kennedy based on the mortgage system presented in "Estimates of Home Mortgage Originations, Repayments, and Debt On One-to-Four-Family Residences," Alan Greenspan and James Kennedy, Federal Reserve Board FEDS working paper no. 2005-41.
 This graph shows what Dr. Kennedy calls "active MEW" (Mortgage Equity Withdrawal). This is defined as "Gross cash out" plus the change in the balance of "Home equity loans".
This measure has fallen close to zero, and is an estimate of the impact of MEW on consumption. I believe that when people refinance with cash out or draw down HELOCs, they usually spend the money.
Instead of focusing on the wealth effect from house prices, I think the more important channel for consumption was home equity extraction.
Saturday, June 06, 2009
Foreclosures and the Home ATM
by Calculated Risk on 6/06/2009 04:10:00 PM
From Matt Padilla at the O.C. Register: Do these homeowners deserve help?
Homeowners who treated their houses like cash machines, tapping the equity as home values rose, are among the most likely to end in foreclosure, even more than those who bought at housing’s peak, a new study finds.During the housing bubble, many bought homes they could not afford using "affordability products" like Option ARMs. But there was another group of speculators that lived beyond their means, using their homes like ATM cash machines. I think this an important issues and I'm looking forward to Padilla's article.
Often homeowners have had second, third and even fourth mortgages at time of foreclosure — a trend not adequately addressed by any of the federal or state foreclosure avoidance progams, said Michael LaCour-Little, a finance professor at Cal State Fullerton who authored the study.
...
I plan a bigger story on his findings, but wanted to share a few results now.
...
For example, for the early November 2008 data sample, he tracked 2,358 properties. Here’s what he found:
•They were purchased at an average price of $354,000 and average year of 2002 (long before the housing peak of 2005).
•Total debt on the properties averaged $551,000 at time of foreclosure. That’s 56% more than the properties were worth when purchased, meaning at least that much was cashed out!
•An automatic valuation model estimated average value at time of foreclosure was $317,000, which suggests a combined loan-to-value at foreclosure of more than 170% ($551,000/$317,000). And that is a conservative estimate. Properties that banks later sold had an average resale price of $271,000!
Wednesday, June 03, 2009
Home ATM Cartoon
by Calculated Risk on 6/03/2009 12:54:00 PM
 Click on cartoon for larger image in new window.
Eric Lewis sent me this great cartoon this morning!
I'm sure many homeowners are saying "Uh oh!"
Enjoy ...
Tuesday, June 02, 2009
Foreclosures and the Home ATM
by Calculated Risk on 6/02/2009 10:51:00 PM
"Credit is so loose today that I can buy the groceries I need on a credit card, eat the food tonight, discard the food by tomorrow at noon and finance my debt on a 30-year, amortized loan. How stupid is that? But people do it all the time - and then they wonder why they're in foreclosure."And today from Peter Goodman at the NY Times: Promised Help Is Elusive for Some Homeowners. This article is about homeowners struggling to get loan modifications, but this section reminded me of that Denver Post article:
Mortgage Broker quoted in Denver Post, March 30, 2005 (link no longer works)
Ms. Ulery, 63, is the face of the latest wave of troubled American homeowners, a surge of people in financial danger not because of reckless gambling on real estate, but because of lost income.So far so good ... but:
Far from being one of those who used easy-money loans to speculate on homes proliferating across the desert soil of greater Phoenix, she has lived in the same modest, stucco-sided condo in suburban Mesa for a dozen years. She bought the two-bedroom home in 1997 for $77,500.
Like tens of millions of other American homeowners, she added to her mortgage balance as the value of her condo swelled, at one point exceeding $200,000. She refinanced to pay off some credit cards and settle into a 30-year, fixed-rate loan. Later, she took out a home equity line of credit to buy a new Hyundai. She refinanced again in 2007, borrowing $20,000, mostly for a new roof.Money is fungible, but a general guideline is to match the term of the debt with the useful life of the asset. A 30 year loan for a house. A 5 to 7 year loan for a car. Pay cash for lunch.
Then - if the useful life and debt term match - when it comes time to replace the asset, the debt will have been retired. But this article provides an example of buying lunch on your credit card, paying off the credit card with a larger mortgage and essentially financing lunch for 30 years!
And I'm sorry, but I'd call excessive use of the Home ATM as gambling.
Wednesday, May 13, 2009
MEW, Consumption and Personal Saving Rate
by Calculated Risk on 5/13/2009 09:29:00 PM
Here is a new paper on Mortgage Equity Withdrawal (MEW): House Prices, Home Equity-Based Borrowing, and the U.S. Household Leverage Crisis by Atif Mian and Amir Sufi (both University of Chicago Booth School of Business and NBER) (ht Jan Hatzius)
From the authors abstract (the entire paper is available at the link):
Using individual-level data on homeowner debt and defaults from 1997 to 2008, we show that borrowing against the increase in home equity by existing homeowners is responsible for a significant fraction of both the sharp rise in U.S. household leverage from 2002 to 2006 and the increase in defaults from 2006 to 2008. Employing land topology-based housing supply elasticity as an instrument for house price growth, we estimate that the average homeowner extracts 25 to 30 cents for every dollar increase in home equity. Money extracted from increased home equity is not used to purchase new real estate or pay down high credit card debt, which suggests that consumption is a likely use of borrowed funds. Home equity-based borrowing is stronger for younger households, households with low credit scores, and households with high initial credit card utilization rates. Homeowners in high house price appreciation areas experience a relative decline in default rates from 2002 to 2006 as they borrow heavily against their home equity, but experience very high default rates from 2006 to 2008. Our estimates suggest that home equity based borrowing is equal to 2.3% of GDP every year from 2002 to 2006, and accounts for over 20% of new defaults in the last two years.A couple of key points:
emphasis added
And this brings us to the personal saving rate.
In an earlier post I argued that the saving rate declined into the early '90s because of demographic changes, however I expected the saving rate to start to rise as the boomers reached their mid-40s (in the late 1990s). Obviously this didn't happen.
I posited that the wealth effect from the twin bubbles - stock market and housing - had led the boomers into believing they had saved more than they actually had.
This research suggests that MEW played a significant role in suppressing the saving rate too. And since the Home ATM is now closed, this is more evidence that the saving rate will increase (probably back to 8% or so) - and keep pressure on the growth of personal consumption expenditures (PCE).
For background, here are couple of graphs:
 Click on graph for large image.
The first graph shows the annual saving rate back to 1929.
Notice that the saving rate went negative during the Depression as household used savings to supplement income. And the saving rate rose to over 25% during WWII.
There is a long period of a rising saving rate (from after WWII to about 1974) and a long period of a declining saving rate (from the early '80s to 2008). (corrected text)
Some of the change in saving rate was related to demographics. As the large baby boom cohort entered the work force in the mid '70s, the saving rate declined (younger families usually save less). But, as I noted above, I expected the saving rate to start to increase in the last '90s.
And here are the Kennedy-Greenspan estimates (NSA - not seasonally adjusted) of home equity extraction through Q4 2008, provided by Jim Kennedy based on the mortgage system presented in "Estimates of Home Mortgage Originations, Repayments, and Debt On One-to-Four-Family Residences," Alan Greenspan and James Kennedy, Federal Reserve Board FEDS working paper no. 2005-41.
NOTE: Anyone who wants the Equity Extraction data, please see this post for a spreadsheet and how to credit Dr. Kennedy's work.
This graph shows what Dr. Kennedy calls "active MEW" (Mortgage Equity Withdrawal). This is defined as "Gross cash out" plus the change in the balance of "Home equity loans".This measure is near zero ($7.2 billion for the quarter) and is an estimate of the impact of MEW on consumption. When people refinance with cash out or draw down HELOCs, they usually spend the money.
Sunday, March 29, 2009
Personal Saving and Mortgage Equity Withdrawal
by Calculated Risk on 3/29/2009 03:42:00 PM
Much has been made about the personal saving rate falling to zero during the housing bubble, and rising sharply in recent months. This decline in the saving rate was probably related to homeowner's borrowing against their homes.
During the housing bubble there was a huge surge in home equity borrowing or cash-out refinancing - commonly called mortgage equity withdrawal (MEW) - that led many people to spend more than their usually defined disposable personal income (DPI). (ht Professor Martha Olney)
However this didn't capture MEW. The following two graphs show the impact of MEW. Note: I used 50% of MEW, because that appears to be the amount consumed. Click on graph for larger image in new window.
The first graph shows disposal personal income (blue), disposal personal income plus MEW (green) and personal outlays (red). Note: Graph doesn't start at zero to better show the change.
The BEA defines personal saving as the difference between the blue and red lines:
Personal Savings = Disposable Personal Income - Personal Outlays
However many people acted as if MEW was income, and that would mean personal saving was the difference between the green and red lines. The second graph shows the same data except as a saving rate.
As Professor Olney mentioned to me, the aggregate saving rate captures the behavior of both savers (who probably didn't change their behavior) and "dissavers" (who borrowed heavily). The saving rate declined to zero, probably because the dissavers were using MEW as income.
Now that the Home ATM is closed, the saving rate is rising because of less borrowing - as dissavers are forced to live within their incomes.
Tuesday, March 24, 2009
Equity Extraction Data
by Calculated Risk on 3/24/2009 09:07:00 PM
Earlier today I graphed the mortgage equity extraction data for Q4 2008 from Dr. James Kennedy at the Fed.
Thanks again to Dr. Kennedy for all the data!
For those interested, here is the equity extraction data from the Fed (excel file) Enjoy!
IMPORTANT NOTE: If you use this data, please read this note from the Fed:
Attached are the estimates of home equity extraction and related data through the fourth quarter of 2008, courtesy of Jim Kennedy. Please note that there will be no further updates to this data series.Here is a repeat of the total MEW graph:
These data are the product of a research project undertaken by Jim and Alan Greenspan. The data are not an official publication or product of the Federal Reserve Board. If you cite these data, please reference one of the two papers that Jim wrote with Alan Greenspan. For example, a reference might read something like this:
"Updated estimates provided by Jim Kennedy of the mortgage system presented in "Estimates of Home Mortgage Originations, Repayments, and Debt On One-to-Four-Family Residences," Alan Greenspan and James Kennedy, Federal Reserve Board FEDS working paper no. 2005-41."
Since the fall of 2005, when the first paper Jim wrote with Alan Greenspan was released, Jim has updated the data periodically, usually quarterly, a few days after publication of the Flow of Funds data.
 Click on graph for larger image in new window.
For Q4 2008, Dr. Kennedy has calculated Net Equity Extraction as minus $77 billion, or negative 2.9% of Disposable Personal Income (DPI).
This graph shows the net equity extraction, or mortgage equity withdrawal (MEW), results, both in billions of dollars quarterly (not annual rate), and as a percent of personal disposable income.
Q4 Mortgage Equity Extraction Strongly Negative
by Calculated Risk on 3/24/2009 11:37:00 AM
Here are the Kennedy-Greenspan estimates (NSA - not seasonally adjusted) of home equity extraction for Q4 2008, provided by Jim Kennedy based on the mortgage system presented in "Estimates of Home Mortgage Originations, Repayments, and Debt On One-to-Four-Family Residences," Alan Greenspan and James Kennedy, Federal Reserve Board FEDS working paper no. 2005-41. Click on graph for larger image in new window.
For Q4 2008, Dr. Kennedy has calculated Net Equity Extraction as minus $77 billion, or negative 2.9% of Disposable Personal Income (DPI).
This graph shows the net equity extraction, or mortgage equity withdrawal (MEW), results, both in billions of dollars quarterly (not annual rate), and as a percent of personal disposable income. Dr. Kennedy provides several other measures of equity extraction. The second graph shows what Dr. Kennedy calls "active MEW" (Mortgage Equity Withdrawal). This is defined as "Gross cash out" plus the change in the balance of "Home equity loans".
This measure is near zero ($7.2 billion for the quarter) and is probably a better estimate of the impact of MEW on consumption. When people refinance with cash out or draw down HELOCs, they usually spend the money.
The Fed's Flow of Funds report shows the amount of mortgages outstanding is declining, and this is partially because of debt cancellation per foreclosure sales, and partially due to homeowners paying down their mortgages (as opposed to borrowing more). Note: most homeowners pay down their principal a little each month (unless they have an IO or Neg AM loan), so with no new borrowing, equity extraction would always be negative.
Clearly the Home ATM has now been closed for a few quarters.
Note: This will be the last update of MEW from Dr. Kennedy. My thanks to Jim Kennedy and the other contributors to the MEW updates.
Wednesday, March 11, 2009
Setser on the Decline in China's Exports
by Calculated Risk on 3/11/2009 10:51:00 AM
From Brad Setser: The fall in China’s exports caught up with the fall in China’s imports, at least for now
After soaring for most of this decade — the pace of China’s export growth clearly turned up in 2002 or 2003 and then stayed at a very high pace — China’s exports are falling back to earth. The surge in China’s exports could prove to be as unsustainable as the rise in US (and some European) home prices. They might end up being mirror images … as Americans and Europeans could only import so much from China so long as they could borrow against rising home prices.
emphasis added

Historically there has been a strong correlation between household mortgage equity withdrawal (MEW) in the U.S. and the U.S. trade deficit. Now that MEW is essentially over, the U.S. trade deficit has declined sharply too.
As Setser suggests, the surge in China's exports were very dependent on the U.S. and European housing bubbles - and MEW.
Note: Q4 MEW will probably be available next week (the Fed's Flow of Funds report will be released tomorrow).
Friday, December 19, 2008
Q3 2008: Mortgage Equity Extraction Strongly Negative
by Calculated Risk on 12/19/2008 10:55:00 AM
Here are the Kennedy-Greenspan estimates (NSA - not seasonally adjusted) of home equity extraction for Q3 2008, provided by Jim Kennedy based on the mortgage system presented in "Estimates of Home Mortgage Originations, Repayments, and Debt On One-to-Four-Family Residences," Alan Greenspan and James Kennedy, Federal Reserve Board FEDS working paper no. 2005-41.  Click on graph for larger image in new window.
For Q3 2008, Dr. Kennedy has calculated Net Equity Extraction as minus $64.1 billion, or negative 2.4% of Disposable Personal Income (DPI).
This graph shows the net equity extraction, or mortgage equity withdrawal (MEW), results, both in billions of dollars quarterly (not annual rate), and as a percent of personal disposable income.  Dr. Kennedy provides several other measures of equity extraction. The second graph shows what Dr. Kennedy calls "active MEW" (Mortgage Equity Withdrawal). This is defined as "Gross cash out" plus the change in the balance of "Home equity loans".
This measure is also slightly negative.
The Fed's Flow of Funds report shows the amount of mortgages outstanding is declining, and this is partially because of debt cancellation per foreclosure sales, and partially due to homeowners paying down their mortgages (as opposed to borrowing more). Note: most homeowners pay down their principal a little each month (unless they have an IO or Neg AM loan), so with no new borrowing, equity extraction would always be negative.
But this suggests that the Home ATM is closed, and MEW is no longer supporting consumption.
Monday, November 03, 2008
Advance Q3 2008 MEW Estimate
by Calculated Risk on 11/03/2008 03:48:00 PM
We've been tracking mortgage equity withdrawal (MEW) to estimate when the "Home ATM" has closed. Fed economist Dr. James Kennedy's estimate of MEW is not available until after the Fed's Flow of Funds report is released each quarter. Note: the Q3 Flow of Funds report is scheduled to be released on December 11, 2008.
However it is possible to estimate MEW from supplemental data released with the GDP report. Based on the Q3 GDP data from the BEA, my advance estimate for Mortgage Equity Withdrawal (MEW) is 1.0% of Disposable Personal Income (DPI). This would be slightly higher than the Q2 estimates, from the Fed's Dr. Kennedy, of 0.4% of Disposable Personal Income (DPI). Click on graph for larger image in new window.
This graph compares my advance MEW estimate (as a percent of DPI) with the MEW estimate from Dr. James Kennedy at the Federal Reserve. The correlation is pretty high, but there are differences quarter to quarter. This analysis does suggest that MEW was at about the same level in Q3 2008, as in Q2 (close to zero). We will have to wait until December to know for sure.
MEW has declined precipitously since early 2006, with a combination of tighter lending standards and falling house prices. The impact of less equity extraction on consumer spending is still being debated, but I believe a portion of the slowdown in personal consumption expenditures can be attributed to less MEW.


