 RSS Feed
 by Calculated Risk on 4/12/2025 02:11:00 PM
Saturday, April 12, 2025
Real Estate Newsletter Articles this Week: "Home Prices Continue to Cool"
At the Calculated Risk Real Estate Newsletter this week:
 Click on graph for larger image.
• Part 1: Current State of the Housing Market; Overview for mid-April 2025
• Part 2: Current State of the Housing Market; Overview for mid-April 2025
• 2nd Look at Local Housing Markets in March
• ICE Mortgage Monitor: Home Prices Continue to Cool
• 1st Look at Local Housing Markets in March
This is usually published 4 to 6 times a week and provides more in-depth analysis of the housing market.
Schedule for Week of April 13, 2025
by Calculated Risk on 4/12/2025 08:11:00 AM
The key reports this week are March Retail Sales and Housing Starts.
For manufacturing, the March Industrial Production report, and NY and Philly Fed surveys will be released this week.
Fed Chair Jerome Powell speaks on Wednesday.
No major economic releases scheduled.
8:30 AM: The New York Fed Empire State manufacturing survey for April. The consensus is for a reading of -10.0, up from -20.0.
7:00 AM ET: The Mortgage Bankers Association (MBA) will release the results for the mortgage purchase applications index.
 8:30 AM: Retail sales for March is scheduled to be released. The consensus is for a 1.3% increase in retail sales.
 This graph shows the year-over-year change in retail sales and food service (ex-gasoline) since 1993.
 9:15 AM: The Fed will release Industrial Production and Capacity Utilization for March.
This graph shows industrial production since 1967.
The consensus is for a 0.3% decrease in Industrial Production, and for Capacity Utilization to decrease to 77.9%.
10:00 AM: The April NAHB homebuilder survey. The consensus is for a reading of 37, down from 29. Any number below 50 indicates that more builders view sales conditions as poor than good.
1:30 PM: Speech, Fed Chair Jerome Powell, Economic Outlook, At the Economic Club of Chicago, Chicago, Ill.
8:30 AM: The initial weekly unemployment claims report will be released. The consensus is for 224 initial claims up from 223 thousand last week.
 8:30 AM ET: Housing Starts for March.
 This graph shows single and multi-family housing starts since 1968.
The consensus is for 1.410 million SAAR, down from 1.501 million SAAR in February.
8:30 AM: the Philly Fed manufacturing survey for April. The consensus is for a reading of 6.7, down from 12.5.
All US markets will be closed in observance of Good Friday.
10:00 AM: State Employment and Unemployment (Monthly) for March 2025
Friday, April 11, 2025
April 11th COVID Update: COVID Deaths Continue Declining
by Calculated Risk on 4/11/2025 07:27:00 PM
 Note: Mortgage rates are from MortgageNewsDaily.com and are for top tier scenarios.
For deaths, I'm currently using 4 weeks ago for "now", since the most recent three weeks will be revised significantly.
Note: "Effective May 1, 2024, hospitals are no longer required to report COVID-19 hospital admissions, hospital capacity, or hospital occupancy data." So, I'm no longer tracking hospitalizations.
| COVID Metrics | ||||
|---|---|---|---|---|
| Now | Week Ago | Goal | ||
| Deaths per Week | 466 | 592 | ≤3501 | |
| 1my goals to stop weekly posts. 🚩 Increasing number weekly for Deaths. ✅ Goal met. | ||||
 Click on graph for larger image.
This graph shows the weekly (columns) number of deaths reported since Jan 2023.
Although weekly deaths met the original goal to stop posting in June 2023 (low of 314 deaths), I've continued to post since deaths are above the goal again - and I'll continue to post until weekly deaths are once again below the goal.
Weekly deaths are now decreasing following the winter pickup and just under double the low of last June.
 This appears to be a leading indicator for COVID hospitalizations and deaths. This has been moving down.
Nationally COVID in wastewater is "Low".
Realtor.com Reports Active Inventory Up 30.3% YoY
by Calculated Risk on 4/11/2025 02:59:00 PM
What this means: On a weekly basis, Realtor.com reports the year-over-year change in active inventory and new listings. On a monthly basis, they report total inventory. For March, Realtor.com reported inventory was up 28.5% YoY, but still down 20.2% compared to the 2017 to 2019 same month levels.
Now - on a weekly basis - inventory is up 30.3% YoY.
Realtor.com has monthly and weekly data on the existing home market. Here is their weekly report: Weekly Housing Trends View—Data for Week Ending April 5, 2025 Here is a graph of the year-over-year change in inventory according to realtor.com.
Inventory was up year-over-year for the 74th consecutive week.
Realtor.com has monthly and weekly data on the existing home market. Here is their weekly report: Weekly Housing Trends View—Data for Week Ending April 5, 2025
• Active inventory climbed 30.3% from a year ago
The number of homes actively for sale remains significantly higher than last year, continuing a 74-week streak of annual gains. This year-over-year inventory growth gives buyers more choices and encourages more competitive pricing among sellers. Generally, the number of homes up for sale is still below pre-pandemic norms, and the long-standing supply gap will continue to put pressure on prices in under-supplied areas.
• New listings—a measure of sellers putting homes up for sale—increased 8.6%
New listings were up 8.6% compared with this time last year, marking the 13th straight week of annual growth.
• The median list price increased 0.1% year over year
The national median list price was up 0.1% compared with a year ago, marking the first year-over-year increase after 44 weeks of flat or declining prices. However, more data is needed to determine whether this modest growth signals a true turnaround. In particular, recent economic uncertainty may dampen buyer interest, potentially putting downward pressure on prices.
 Here is a graph of the year-over-year change in inventory according to realtor.com.
 Inventory was up year-over-year for the 74th consecutive week.
New listings have increased but remain below typical pre-pandemic levels.
Median prices are mostly unchanged year-over-year.
Q1 GDP Tracking: Near Zero Growth
by Calculated Risk on 4/11/2025 12:06:00 PM
From BofA:
Since our last publication, our 1Q GDP tracking has remained unchanged at 0.4% q/q saar. [Apr 11th estimate]From Goldman:
emphasis added
We left our Q1 GDP tracking estimate unchanged at +0.3% (quarter-over-quarter annualized). [Apr 3rd estimate]
 And from the Atlanta Fed: GDPNow
The GDPNow model estimate for real GDP growth (seasonally adjusted annual rate) in the first quarter of 2025 is -2.4 percent on April 9, up from -2.8 percent on April 3. The alternative model forecast, which adjusts for imports and exports of gold as described here, is -0.3 percent. After recent releases from the US Census Bureau and the US Bureau of Labor Statistics, both the standard model’s and the alternative model’s forecasts of first-quarter real final sales to private domestic purchasers growth increased from 1.4 percent to 2.0 percent. [Apr 9th estimate]
2nd Look at Local Housing Markets in March
by Calculated Risk on 4/11/2025 09:02:00 AM
Today, in the Calculated Risk Real Estate Newsletter: 2nd Look at Local Housing Markets in March
A brief excerpt:
This is the second look at several early reporting local markets in March. I’m tracking over 40 local housing markets in the US. Some of the 40 markets are states, and some are metropolitan areas. I’ll update these tables throughout the month as additional data is released.There is much more in the article.
Closed sales in March were mostly for contracts signed in January and February when 30-year mortgage rates averaged 6.96% and 6.84%, respectively (Freddie Mac PMMS). This was an increase from the average rate for homes that closed in February. This was before the recent surge in economic uncertainty and stock market volatility that might impact existing home sales.
...
In March, sales in these markets were down 1.3% YoY. Last month, in February, these same markets were down 6.2% year-over-year Not Seasonally Adjusted (NSA).
Important: There were the same number of working days in March 2025 (21) as in March 2024 (21). So, the year-over-year change in the headline SA data will be close to the change in the NSA data (there are other seasonal factors).
...
This was just several early reporting markets. Many more local markets to come!

Thursday, April 10, 2025
Friday: PPI
by Calculated Risk on 4/10/2025 07:50:00 PM
 Note: Mortgage rates are from MortgageNewsDaily.com and are for top tier scenarios.
Friday:
• At 8:30 AM ET, The Producer Price Index for March from the BLS. The consensus is for a 0.2% increase in PPI, and a 0.3% increase in core PPI.
• At 10:00 AM, University of Michigan's Consumer sentiment index (Preliminary for April).
Hotels: Occupancy Rate Decreased 0.6% Year-over-year
by Calculated Risk on 4/10/2025 03:47:00 PM
The U.S. hotel industry reported mixed year-over-year comparisons, according to CoStar’s latest data through 5 April. ...The following graph shows the seasonal pattern for the hotel occupancy rate using the four-week average.
30 March through 5 April 2025 (percentage change from comparable week in 2024):
• Occupancy: 63.8% (-0.6%)
• Average daily rate (ADR): US$160.18 (+1.4%)
• Revenue per available room (RevPAR): US$102.21 (+0.8%)
emphasis added
 Click on graph for larger image.
The red line is for 2025, blue is the median, and dashed light blue is for 2024. Dashed purple is for 2018, the record year for hotel occupancy.
The 4-week average of the occupancy rate is tracking last year and is at the median rate for the period 2000 through 2024 (Blue).
Note: Y-axis doesn't start at zero to better show the seasonal change.
The 4-week average will mostly move sideways until the summer travel season. We might see a hit to occupancy during the summer months due to less international tourism.
Part 2: Current State of the Housing Market; Overview for mid-April 2025
by Calculated Risk on 4/10/2025 12:45:00 PM
Today, in the Calculated Risk Real Estate Newsletter: Part 2: Current State of the Housing Market; Overview for mid-April 2025
A brief excerpt:
Yesterday, in Part 1: Current State of the Housing Market; Overview for mid-April 2025 I reviewed home inventory, housing starts and sales.There is much more in the article.
In Part 2, I will look at house prices, mortgage rates, rents and more.
These “Current State” summaries show us where we came from, where we are, and hopefully give us clues as to where we are going!
Note: Yesterday, I expressed concern about policy impacting housing and the economy. Then, at 12:57 PM ET, Goldman Sachs economists put out a note titled: Moving to a Recession Baseline. They argued - based on announced tariffs - that they were forecasting a recession and for the unemployment rate to rise to 5.7% in Q4.
Minutes later, a 90-day pause for most tariffs was announced (reducing tariffs to 10%, except China). An hour later Goldman Sachs put out a second note: Reverting to Our Previous Non-Recession Baseline. However, they still maintained a 45% change of recession in the next 12 months.
Forecasting is especially difficult with rapidly changing policy!
...
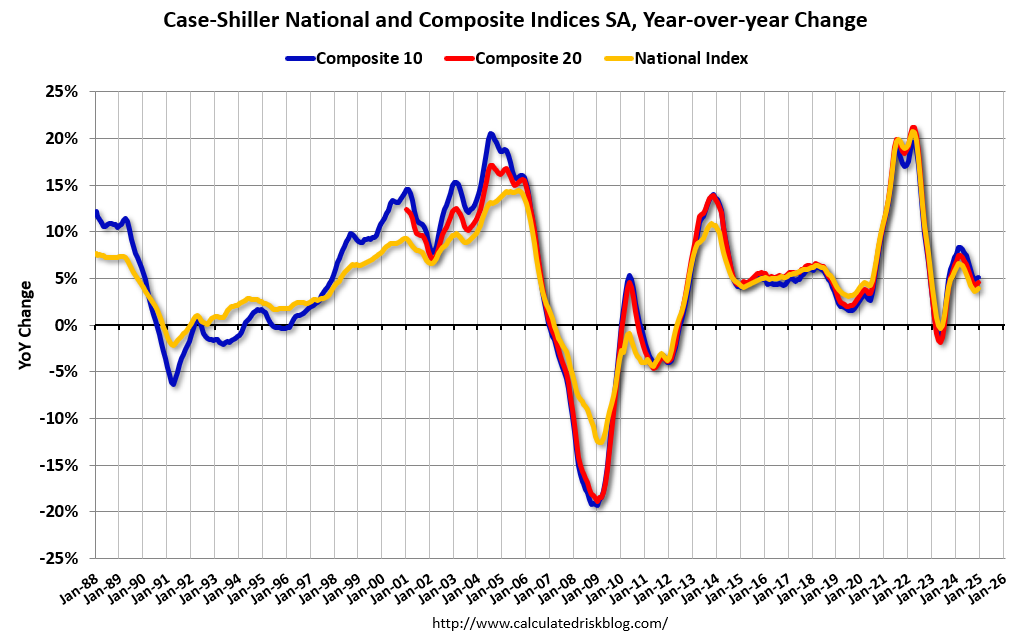
The Case-Shiller National Index increased 4.1% year-over-year (YoY) in January and will be about the same YoY - or slightly lower - in the February report (based on other data).
The MoM increase in the seasonally adjusted (SA) Case-Shiller National Index was at 0.57% (a 7.0% annual rate), This was the 24th consecutive MoM increase in the seasonally adjusted index.
Cleveland Fed: Median CPI increased 0.3% and Trimmed-mean CPI increased 0.2% in February
by Calculated Risk on 4/10/2025 11:20:00 AM
The Cleveland Fed released the median CPI and the trimmed-mean CPI.
According to the Federal Reserve Bank of Cleveland, the median Consumer Price Index rose 0.3% in February. The 16% trimmed-mean Consumer Price Index increased 0.2%. "The median CPI and 16% trimmed-mean CPI are measures of core inflation calculated by the Federal Reserve Bank of Cleveland based on data released in the Bureau of Labor Statistics’ (BLS) monthly CPI report".
 Click on graph for larger image.
This graph shows the year-over-year change for these four key measures of inflation.
On a year-over-year basis, the median CPI rose 3.5% (down slightly unrounded from 3.5% YoY in February), the trimmed-mean CPI rose 3.0% (down from 3.1%), and the CPI less food and energy rose 2.8% (down from 3.1%).
Core PCE is for February was up 2.8% YoY, up from 2.7% in January. Based on the CPI report this morning, Core PCE is expected to decline to 2.6% YoY in March.


