by Calculated Risk on 11/25/2008 03:23:00 PM
Tuesday, November 25, 2008
House Prices vs. PCE
Earlier I posted the Case-Shiller monthly house prices, the house price-to-rent ratio, and the house price-to-income ratio.
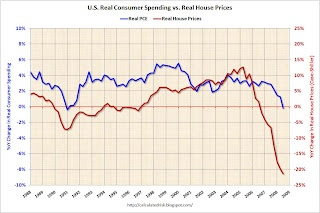
Here is a look at the real year-over-year (YoY) change in house prices vs. personal consumption expenditures (PCE):  Click on image for larger graph in new window.
This graph compares the YoY change in real house prices with the YoY change in real PCE.
For this limited data set (house price data is only available since 1987) the YoY changes move somewhat together, although house prices started declining before PCE during the current economic downturn. This difference in timing could be because of homeowners withdrawing equity from their homes (the Home ATM) even after prices first started falling. However recent data shows that the Home ATM is now pretty much closed - and as expected consumption has started to decline sharply.
Based on this general relationship, I wouldn't be surprised to see the YoY change in real PCE fall to -4% or so at some point next year.


