by Calculated Risk on 8/19/2008 01:29:00 PM
Tuesday, August 19, 2008
Single Family Homes: Quarterly Data on Starts and Sales
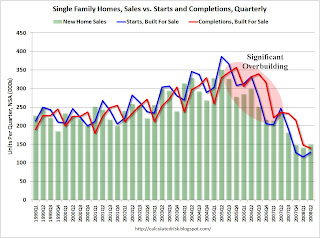
It is difficult to compare monthly housing starts directly to sales. The monthly housing starts report from the Census Bureau includes apartments, owner built units and condos that are not included in the New Home sales report. However, every quarter, the Census Bureau releases Starts by Intent, and it is possible to compare "Single Family Starts, Built for Sale" to New Home sales. Click on graph for larger image in new window.
This graph compares quarterly starts of single family homes built for sale (and completions of single family homes built for sale in red) with New Home sales.
This data is not seasonally adjusted for any series. There are clear seasonal patterns for all series, and completions lag starts by about 6 months.
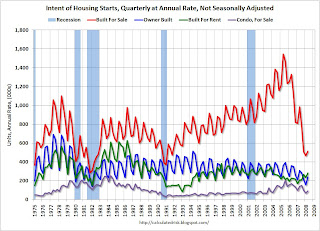
The period of significant overbuilding in recent years is highlighted. It now appears that starts and completions are running below sales. Note that most new home sales occur before a housing unit is started, so completions lag sales. The second graph shows the quarterly starts by intent at an annual rate through Q2 2008. This shows 1) Single Family starts built for sale, 2) Owner built units, 3) Units built for rent, and 4) Condos built for sale.
As of Q2, Single Family starts built for sale, had rebounded slightly to 512 thousand on a non seasonally adjusted annual rate. As noted above, this level of starts is below the current level of New Home sales.
Note the minor seasonal rebound for Single family starts built for sale. There was no Spring for housing in 2008.
Also, starts for condos has fallen significantly - just slightly above the average level of the '90s.
Rental units are the lone bright spot (other than minor seasonal upswings), and it was rental units that accounted for the increase in overall starts for June (somewhat because of the changes in the NY construction code). With the rental vacancy rate at 10.0%, the rental construction will probably decline in Q3.
There is still a huge overhang of existing home inventory for sale (especially distressed inventory including short sales and REOs), and until that inventory declines significantly, starts and housing prices will remain under pressure. However this report does provide some evidence that the home builders are starting fewer homes than they are selling.


