by Calculated Risk on 2/27/2008 05:36:00 PM
Wednesday, February 27, 2008
New Home Months of Supply
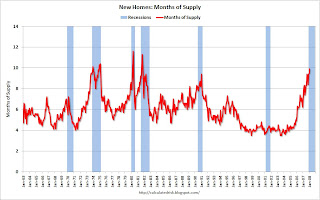
Another long term graph today - this one for New Home Months of Supply. Click on graph for larger image.
"Months of supply" is at the highest level since 1981. Note that this doesn't include cancellations, but that was true for the earlier periods too.
The all time high for Months of Supply was 11.6 months in April 1980.
Once again, the current recession is "probable" and hasn't been declared by NBER.
Note: Months of supply is calculated by dividing inventory (seasonally adjusted) by sales (SAAR) and multiplying by 12 (to convert to months). As an example, Sales were reported at a Seasonally Adjusted Annual rate of 588K this morning. Inventory was reported at 483K. So 483K divided by 588K times 12 = 9.9 months.


