 RSS Feed
 by Calculated Risk on 2/28/2007 04:50:00 PM
Wednesday, February 28, 2007
When Changes in Subprime Lending Standards will Impact Home Sales
It has only been during the last couple of weeks that lenders have been tightening some of their lending standards. The New Century and HSBC losses were announced on February 7th, and the Fremont lending changes were announced on Feb 12th.
These changes will probably have a measurable impact on sales in 2007. See: Subprime: The impact on Existing Home Sales in 2007
Since New Home sales are counted when contracts are signed, these changes in lending standards will probably show up in the March numbers (announced in April).
Existing home sales are counted at the close of escrow. So these changes might start showing up in the March numbers if earlier sales fail to close (announced in April) or possible in the April numbers (announced in May).
But I wouldn't expect any impact on the February numbers to be announced in March.
More on January New Home Sales
by Calculated Risk on 2/28/2007 12:01:00 PM
For more graphs, please see the earlier post: January New Home Sales: 0.937 Million SAAR Click on graph for larger image.
The first graph shows New Home Sales vs. Recession for the last 35 years. New Home sales were falling prior to every recession, with the exception of the business investment led recession of 2001. This should raise concerns about a possible consumer led recession in the months ahead.
The second graph shows Not Seasonally Adjusted (NSA) New Home Sales for January.
Sales have fallen back close to the levels of '99 - '02.
The third graph shows monthly NSA New Home sales. This provides a different prospective of the housing bust.
This shows why the Spring selling season is so important in 2007. Will sales recover? Or will Spring 2007 look like 1982 or 1991 when Spring sales were disappointing.
MBA: Mortgage Applications Increase in Weekly Survey
by Calculated Risk on 2/28/2007 11:26:00 AM
The Mortgage Bankers Association (MBA) reports: Mortgage Applications Increase
This week’s results include an adjustment to account for the Presidents Day holiday. The Market Composite Index, a measure of mortgage loan application volume, was 626.1, an increase of 3.2 percent on a seasonally adjusted basis from 606.6 one week earlier. On an unadjusted basis, the Index decreased 5.4 percent compared with the previous week and was up 8.8 percent compared with the same week one year earlier.Mortgage rates were mixed:
The Refinance Index increased 1.2 percent to 1943.5 from 1921.1 the previous week and the seasonally adjusted Purchase Index increased 5.2 percent to 401.3 from 381.4 one week earlier.
The average contract interest rate for 30-year fixed-rate mortgages decreased to 6.16 percent from 6.19 percent ...
The average contract interest rate for one-year ARMs increased to 5.92 from 5.81 percent ...
 Click on graph for larger image.
This graph shows the Purchase Index and the 4 and 12 week moving averages since January 2002. The four week moving average is down 0.4 percent to 397 from 398.7 for the Purchase Index.
The refinance share of mortgage activity decreased to 43.2 percent of total applications from 44.9 percent the previous week. The adjustable-rate mortgage (ARM) share of activity decreased to 21.1 from 21.2 percent of total applications from the previous week.
January New Home Sales: 0.937 Million SAAR
by Calculated Risk on 2/28/2007 10:12:00 AM
According to the Census Bureau report, New Home Sales in January were at a seasonally adjusted annual rate of 0.937 million. Sales for December were revised up slightly to 1.123 million, from 1.120 million. Numbers for October and November were revised downwards. 
Click on Graph for larger image.
Sales of new one-family houses in January 2007 were at a seasonally adjusted annual rate of 937,000 ... This is 16.6 percent below the revised December rate of 1,123,000 and is 20.1 percent below the January 2006 estimate of 1,173,000.
The Not Seasonally Adjusted monthly rate was 70,000 New Homes sold. There were 89,000 New Homes sold in January 2006.
On a year over year NSA basis, January 2007 sales were 21.3% lower than January 2006. January '07 sales were the lowest since January 2002 (66,000).
The median and average sales prices were up. Caution should be used when analyzing monthly price changes since prices are heavily revised.
The median sales price of new houses sold in January 2007 was $239,800; the average sales price was $313,000.
The seasonally adjusted estimate of new houses for sale at the end of January was 536,000.
The 536,000 units of inventory is slightly below the levels of the last six months. Inventory numbers from the Census Bureau do not include cancellations - and cancellations are at record levels. Actual New Home inventories are much higher - some estimate about 20% higher.
This represents a supply of 6.8 months at the current sales rate.
More later today on New Home Sales.
GDP Revisions
by Calculated Risk on 2/28/2007 09:46:00 AM
From MarketWatch: Fourth-quarter GDP revised down to 2.2%
The U.S. economy has now grown at a rate of less than 3% for three quarters in a row, government data show, after a significant downward revision to fourth-quarter estimates.Gross private domestic investment was revised downwards significantly, even though residential investment (RI) was essentially unchanged. RI was revised slightly from -19.2% (SAAR) to -19.1% for Q4.
The economy grew at a real annual rate of 2.2% in the three months of 2006, not at the 3.5% rate reported last month, the Commerce Department said Wednesday.
While consumer spending remained healthy, slower investments in homes, businesses and inventories were a major drag on growth in the quarter.
Perhaps ominously, nonresidential investment was revised downwards from -0.4% to -2.4%. Investment in equipment and software was revised downwards from -1.8% to -3.2%. And nonresidential structures (a key category) was revised downwards from 2.8% to -0.8%.
As mentioned yesterday, nonresidential investment typically trails residential investment by three to five quarters. So a nonresidential investment slump, starting about now, is expected based on historical investment patterns (See Investment Lags for an analysis of the lag times, as compared to residential investment, for equipment and software, and non-residential structures).
Tuesday, February 27, 2007
Fremont to Postpone Release of Results
by Calculated Risk on 2/27/2007 09:52:00 PM
Press Release: Fremont General Corporation to Postpone Release of Results for 2006
Fremont General Corporation ... a nationwide residential and commercial real estate lender doing business primarily through its wholly-owned industrial bank, Fremont Investment & Loan, today announced that it will postpone the release of its fourth quarter and full-year 2006 results of operations, as well as the conference call to discuss such results, each previously scheduled for February 28, 2007. The Company also announced that it will not file its Annual Report on Form 10-K for the fiscal year ended December 31, 2006 by March 1, 2007 and that it intends to file a Form 12b-25 with the Securities and Exchange Commission explaining the reasons therefor.
For Manufacturing, a Recession Has Arrived
by Calculated Risk on 2/27/2007 09:34:00 PM
From the NY Times: For Manufacturing, a Recession Has Arrived
The nation’s manufacturing sector managed to slip into a recession with almost nobody seeming to notice. Well, until yesterday.And it's not just manufacturing. See Menzie Chinn's charts at Econbrowser: The Fundamentals Are...
FDIC: Housing Slowdown Poses Challenge to Bank Loan Growth
by Calculated Risk on 2/27/2007 06:24:00 PM
From the FDIC: FDIC Reports that Housing Slowdown Poses Challenge to Bank Loan Growth
The recent slowdown in residential construction could reduce the demand for mortgages and commercial real estate and construction loans -- activities that have been important factors in loan growth for banks and thrift institutions in recent years. That's according to the Winter 2006 edition of FDIC Outlook released today, which analyzes economic and banking conditions in each of the eight FDIC regions.Here is the conclusion from the San Francisco Region report:
"While employment and income trends are positive in almost every region, the effects of the slowdown in residential construction activity are clearly visible," said FDIC Chairman Sheila C. Bair. "Going forward, insured banking institutions should pay careful attention to risk-management processes in this slower-growth environment."
Despite current strong economic and banking conditions in the West, increased reliance on historically volatile construction activity may stress local economies and the banking sector should the housing sector continue to weaken. An extended or sharp slowdown in construction activity could ripple through local economies and bank balance sheets and income statements. Although strength in other sectors—particularly the services sector—has emerged recently and could mitigate some of the negative effects of a slowing construction sector, elevated CRE and construction lending concentrations at FDIC-insured institutions will continue to be monitored closely for any signs of weakening in credit quality.This is an understated warning. Especially concerning is the "elevated construction lending concentrations at FDIC-insured institutions". A CRE and C&D slump could exacerbate the economic problems caused by the housing sector slowdown.
Unfortunately nonresidential investment typically trails residential investment by three to five quarters. So it would not by unusual to see a CRE and C&D investment slump later this year with rising delinquency rates (See Investment Lags for an analysis of the lag times, as compared to residential investment, for equipment and software, and non-residential structures).
And here are the Commercial Bank Delinquency Rates released today by the Federal Reserve (through Q4 2006).
 Click on graph for larger image.
Although commercial real estate delinquency rates are still historically low, they have started to move up. With the heavy concentration of CRE and C&D loans at FDIC institutions, a significant slump (like the early '90s) could pose a serious risk to these financial institutions.

As a review: this graph shows the YoY change in residential investment vs. nonresidential investment through Q4 2007. In general, residential investment leads nonresidential investment. There are periods when this observation doesn't hold - like '95 when residential investment fell and the growth of nonresidential investment remained strong - but it is reasonable, from a historical perspective, to expect a nonresidential investment slump in 2007.
Freddie to Tighten Subprime Mortgage Standards
by Calculated Risk on 2/27/2007 11:24:00 AM
"Some of these products that worked in the past don't work going forward," Chairman and Chief Executive Richard F. Syron, Freddie Mac 2/17/2007From Freddie Mac: Freddie Mac Announces Tougher Subprime Lending Standards to Help Reduce the Risk of Future Borrower Default
Freddie Mac (NYSE: FRE) today announced that it will cease buying subprime mortgages that have a high likelihood of excessive payment shock and possible foreclosure. First, Freddie Mac will only buy subprime adjustable-rate mortgages (ARMs) – and mortgage-related securities backed by these subprime loans – that qualify borrowers at the fully-indexed and fully-amortizing rate. The goal is to protect future borrowers from the payment shock that could occur when their adjustable rate mortgages increase.
Second, the company will limit the use of low-documentation underwriting for these types of mortgages to help ensure that future borrowers have the income necessary to afford their homes. In addition, Freddie Mac will strongly recommend that mortgage lenders collect escrow accounts for borrowers’ taxes and insurance payments.
In keeping with its statutory responsibility to provide stability to the mortgage market, Freddie Mac will implement the new investment requirements for mortgages originated on or after September 1, 2007, to avoid market disruptions.
...
Freddie Mac’s new requirements cover what are commonly referred to as 2/28 and 3/27 hybrid ARMs, which currently comprise roughly three-quarters of the subprime market. Specifically, the company is requiring that borrowers applying for these products be underwritten at the fully- indexed and amortizing rate, as opposed to the initial "teaser" rate. The company also will limit the use of low-documentation products in combination with these loans. For example, the company will no longer purchase "No Income, No Asset" documentation loans and will limit "Stated Income, Stated Assets" products to borrowers whose incomes derive from hard-to-verify sources, such as the self-employed and those in the "cash economy." There will be a reasonableness standard for stated incomes.
In addition, Freddie Mac will require that loans be underwritten to include taxes and insurance and will strongly recommend that the subprime industry collect escrows for taxes and insurance, as is the norm in the prime sector. Because the maintenance of escrow accounts requires significant infrastructure and is not widely used in the subprime sector, Freddie Mac does not believe it is practical to unilaterally mandate it as a purchase requirement at this time.
January Existing Home Sales
by Calculated Risk on 2/27/2007 10:18:00 AM
The National Association of Realtors (NAR) reports: Existing-Home Sales Improve in January Click on graph for larger image.
Total existing-home sales – including single-family, townhomes, condominiums and co-ops – increased 3.0 percent to a seasonally adjusted annual rate1 of 6.46 million units in January from an upwardly revised pace of 6.27 million in December. Sales were 4.3 percent below the 6.75 million-unit level in January 2006.The above graph shows NSA monthly sales for 2005, 2006 and 2007. On an NSA basis, sales were 2.7% below January 2006.

Total housing inventory levels rose 2.9 percent at the end of January to 3.55 million existing homes available for sale, which represents a 6.6-month supply at the current sales pace – unchanged from the revised December level. Supplies peaked at 7.4 months in October.
 Usually 6 to 8 months of inventory starts causing pricing problems, and over 8 months a significant problem. With current inventory levels at 6.6 months of supply, inventories are now well into the danger zone.
Monday, February 26, 2007
O.C. Mortgage Broker on Lending Standards
by Calculated Risk on 2/26/2007 12:26:00 PM
"Loose lending would be more correctly stated as no lending standards."From the O.C. Register: Insider Q&A on home lending pitfalls
Jeff Lazerson, president of Mortgage Grader in Laguna Niguel, Feb 26, 2007
Q. Lets talk about loose underwriting standards. How big of an impact has loose lending had on home prices in Orange County?I don't know if half of the recent price increases were due to "no lending standards", but I do agree that speculation, using non-traditional loans, played an important part in the price boom. I also agree with Lazerson on defaults:
A. "Loose lending would be more correctly stated as no lending standards. I would say that in Orange County and across the country prices have gone up, I would estimate 50 percent more than they should have, just because of no standards in underwriting and lending … Anyone could purchase a property as long as they could manipulate through the paperwork.”
"We haven’t seen anything yet with defaults. It’s going to get a lot worse before it gets better.”
WSJ: Home Lenders Cut the Flow Of Risky Loans
by Calculated Risk on 2/26/2007 12:50:00 AM
From the WSJ: Home Lenders Cut the Flow Of Risky Loans
Fears about defaults are slowing the gusher of investor funds going to riskier segments of the mortgage market. That means less money available for "subprime" loans to riskier borrowers, forcing lenders to focus more on borrowers who can afford down payments and have well documented finances. With fewer lower-income Americans able to buy homes, downward pressure on prices will probably increase.Interesting. And on the same topic, Fleck shares another email: Subprime housing game is over
These pressures have intensified in recent days. The cost of insuring mortgage-bond holders against default risk, as measured by the so-called ABX index, has soared, deepening the concerns of investors in collateralized debt obligations, among the biggest holders of riskier mortgage bonds. Managers of some CDOs are delaying new offerings to "wait for the dust to settle," a process that could take weeks or months, says Chris Flanagan, head of CDO research at J.P. Morgan Chase & Co.
"CDO managers and hedge funds still want to do CDOs, but the conditions are much, much tougher," David Liu, a mortgage analyst with UBS AG, adds.
"... today (last Wednesday) is the first day where equity managers have been in to us, asking questions about subprime. Until today, most of the equity managers knew something bad was happening in subprime, but were prepared to assume it was not going to be a problem for the wider credit market, the economy, and so on. ...
Slowly but surely, people are starting to get it, and slowly but surely, I am starting to think that the tipping point in credit -- via a subprime-generated shambles in CDO (collateralized debt obligation) land -- is closer than anybody imagines."
Sunday, February 25, 2007
Economic Forecast Revisions
by Calculated Risk on 2/25/2007 11:30:00 PM
With the recent subprime mortgage news and the somewhat disappointing economic numbers, I've been looking to see if economists would start revising their forecasts for 2007.
Sure enough, the National Association for Business Economics (NABE) released their quarterly survey of 47 economists, from AP:
... forecasters now believe housing construction will plunge by 14.9 percent this year. That would be nearly three times bigger than the 5.5 percent fall in residential construction they had projected [for 2007] in the [November survey].So once again these economists are "surprised" by housing.
And the impact on GDP?
The panel predicted that the overall economy will grow by 2.7 percent this year. ... NABE's November forecast put GDP growth this year at 2.5 percent.So, three months later, these economists revised their forecasts down significantly for the housing market, and their GDP growth forecast up slightly. Uh, OK.
"Nobody's Buying with all the Foreclosures"
by Calculated Risk on 2/25/2007 12:46:00 PM
From U.S. News & World Report on Denver: A House Unsold, the Dream Dims
The ... result is ... [a] vicious cycle of "for sale" signs, foreclosures, then more "for sale" signs that is all but devastating Montbello. Bank-owned properties now represent more than 80 percent of all homes on the market there, putting even seemingly stable homeowners like Garcia up against a financial wall.Garcia orginally paid $207,000 for this house four and a half years ago.
"I just can't take it anymore," he says of his street's overgrown yards, abandoned houses, and declining property values. "I put so much into this house and this community, but I don't have no equity."
With more than 2,500 square feet, new kitchen cabinets, tile, and a recently finished basement apartment, Garcia's house two years ago "would have gone for $210,000, maybe more," says David Cabrera, the real-estate agent whom Garcia hired last fall to sell the home, now priced at $195,500. "But nobody's buying now with all the foreclosures."
Saturday, February 24, 2007
Tanta on ...
by Calculated Risk on 2/24/2007 01:02:00 AM
From CR: Every time Tanta posts on this blog, I receive a number of emails asking: Who is Tanta? Unfortunately her real identity is a state secret, but hopefully it is sufficient to say that Tanta is an experienced mortgage banker, and also an excellent and entertaining writer.
Holden Lewis recently mentioned Tanta at Bankrate.com:
Tanta ... has vast knowledge of the mortgage biz ... and is an excellent writer. ... if you're a mortgage loan officer or broker, o[r] if you're merely a homeowner who wants to understand the mortgage-servicing business, you must read Tanta's latest post, "Mortgage Servicing for Ubernerds."Mr. Lewis also suggested that "a lot of this will be over your head", but I think you'll find that Tanta makes the inner workings of the mortgage business both interesting and understandable. So if you are interested in the mortgage business - and who isn't right now? - here are a few of Tanta's recent posts:
Tanta 2/20/2007: Mortgage Servicing for UberNerds
Tanta 1/31/2007 on "Scratch and Dent" Loans
Tanta 1/15/2007: Information is Power, Which is Why You Don’t Get Any
Tanta 12/21/2006: On Hybrids, Teasers, and Other Mortgage Guidance Problems
Tanta 12/15/2006: Let Slip the Dogs of Hell
Read, learn, and you'll probably laugh some too! All my best to Tanta.
Friday, February 23, 2007
Foreclosures: "At the beginning of this cycle”
by Calculated Risk on 2/23/2007 03:27:00 PM
From the San Diego Union: Lenders told foreclosure picture grim
Mortgage professionals who are struggling with a national spike in residential foreclosure rates were warned yesterday to expect more of the same in 2007.Record inventories (see previous post) and rising foreclosures in 2007 is two of the keys to my 2007 housing predictions.
Unemployment, mortgage fraud and speculative buying are among the factors behind the recent surge in filings, experts said at a conference of the Mortgage Bankers Association.
And this year $1 trillion in adjustable-rate mortgages are due to reset before Dec. 31.
“This is really a wild card,” said Rick Sharga of the Irvine firm RealtyTrac. “We don't have a precedent.”
Mortgage attorney Daniel D. Phelan echoed Sharga's concerns.The following graph shows Notices of Default (NOD) by year in California since 1992.
“I personally think we are at the beginning of this cycle,” he said. “It is going to get worse before it gets better.”
 Click on graph for larger image.
Home mortgage loans in California went into default last quarter at the highest rate in more than eight years, according to the DataQuick Information Systems research firm. Lenders sent notices of default, the first step in the foreclosure process, to 37,273 California homeowners during the fourth quarter.
Housing Inventory "Grossly Understated"
by Calculated Risk on 2/23/2007 12:28:00 PM
From the Chicago Tribune: Canceled contracts masked glut of homes, economist says
Housing analyst David Seiders told Chicago-area builders Thursday that the federal estimate of 3.5 million homes for sale at the end of 2006 is "grossly understated."Caroline Baum reported on this issue last September: Think Housing's Stabilized? See Cancellations
"There is a big inventory overhang out there, and it's bigger than anybody understands," he said.
In an annual forecast on the local industry in Addison, Seiders, chief economist of the National Association of Home Builders, cited the high level of sales contract cancellations in 2006. It created a snag in the recordkeeping, so many homes marked as sales in government data ended up back on the market too late to be counted as inventory, he said.
"Cancellation rates more than doubled between the end of 2005 and the end of 2006, meaning that net sales for the year nationally may be down 65 percent."
Of course Seiders thinks the bottom is near:
But Seiders was not all gloom, saying the market is probably at the year's low spot right now. He expects slight improvement at midyear.
Toll: Disappointing Sales
by Calculated Risk on 2/23/2007 12:20:00 AM
"We're a little more disappointed than two weeks ago. For President's Day weekend we had good sales, but we didn't have anywhere near the bump up that we normally see. That's disappointing."From AP: Toll Brothers 1Q Profit Falls 67 Percent
Robert Toll, Chief Executive, Toll Brothers
Alex Barron, an analyst with JMP Securities in San Francisco, said he wasn't surprised that Toll's comments have taken a more sober tone.
"Now, he's sounding a bit more concerned and depressed," he said. "You can't have five years of a good time and fix everything in a few quarters."
Thursday, February 22, 2007
BBB- ABX Contracts are "going to zero"
by Calculated Risk on 2/22/2007 08:42:00 PM
From Bloomberg: Subprime Mortgage Derivatives Extend Drop on Moody's Reviews
The perceived risk of owning low- rated subprime mortgage bonds rose to a record for a fifth day after Moody's Investors Service said it may cut the loan servicing ratings of five lenders.Graph from Markit:
An index of credit-default swaps linked to 20 securities rated BBB-, the lowest investment grade, and sold in the second half of 2006 today fell 5.6 percent to 74.2, according to Markit Group Ltd. It's down 24 percent since being introduced Jan. 18, meaning an investor would pay more than $1.12 million a year to protect $10 million of bonds against default, up from $389,000.

The BBB- rated portions of ABX contracts are ``going to zero,'' said Peter Schiff, president of Euro Pacific Capital, a securities brokerage in Darien, Connecticut. ``It's a self- perpetuating spiral, where as subprime companies tighten lending standards they create even more defaults'' by removing demand from the housing market and hurting home prices, he said.
Unemployment Insurance Weekly Claims
by Calculated Risk on 2/22/2007 10:43:00 AM
From the Department of Labor:
In the week ending Feb. 17, the advance figure for seasonally adjusted initial claims was 332,000, a decrease of 27,000 from the previous week's revised figure of 359,000. The 4-week moving average was 328,000, an increase of 1,250 from the previous week's revised average of 326,750.
 Click on graph for larger image.
This graph shows the four moving average weekly unemployment claims since 1968. Although the four week moving average has recently been trending upwards, the level is still fairly low and not a concern.
Also, from the Conference Board today: Help-Wanted Advertising Index Dips Two Points

The Conference Board Help-Wanted Advertising Index — a key measure of job offerings in major newspapers across America — declined two points in January. The Index now stands at 32. It was 38 one year ago.Although both claims and the help-wanted index were slightly weaker than expected, there is nothing indicating a significant slowing of the labor market.
Wednesday, February 21, 2007
Fed's Yellen on Housing
by Calculated Risk on 2/21/2007 08:25:00 PM
"If there is one development to worry about the potential of recession it will be housing."San Francisco Fed President Janet Yellen spoke today in California: The U.S. Economy in 2007. Here are some excerpts on housing:
San Francisco Fed President Janet Yellen, 2/21/2007
[T]he housing sector has been at the leading edge of the overall economic slowdown, and I’d like to turn my attention to that important sector now.It's probably important to understand how "housing construction enters directly into the calculation of real GDP". Every month, the Census Bureau calculates construction spending, value put in place. The BEA uses this number to calculate Residential Investment (RI). This is essentially the amount of money homebuilders spend on construction each month. It doesn't matter if the home is sold, what matters for GDP is that a home is being built.
...
Despite the continued weakness in housing construction, which ... enters directly into the calculation of real GDP, there are some signs of stabilization in other aspects of housing markets, suggesting that construction activity may level out before too long. For example, home sales have steadied somewhat after falling sharply for a year or so. Considering this in combination with the continued drop in housing starts that I mentioned earlier, it is not surprising to find that inventories of unsold homes have begun to shrink. This development suggests that the process of resolving the imbalances between demand and supply in the housing market may be underway, and, as a result, we could very well see the drag on real GDP from housing construction wane later this year.
Since housing completions are still near record levels (even though starts have fallen off a cliff), construction spending hasn't fallen very much yet. And because starts have fallen significantly, we know that the RI component of GDP will continue to decline over the next few quarters. The question is if there will be another downturn in housing or, as Dr. Yellen suggests, the drag from housing will "wane".
However, since home completions are still near record levels, there has been very little impact yet on jobs and consumer spending - at least so far. Those impacts are in the future.
Of course, such a turn of events is by no means a given, because the improvements we’ve seen may just be temporary. ...Although Dr. Yellen mentions the housing wealth effect, I'm surprised she doesn't mention the possible impact of less Mortgage Equity Withdrawal (MEW). The wealth effect and MEW are related, but MEW probably shows up more directly in consumer spending. The wealth effect just means someone feels wealthier and therefore they are a little more willing to spend. However MEW is actual money burning a hole in the consumer's pocket.
In addition to concerns about weakness in housing construction, there has been worry that difficulties related to housing markets could spread to consumer spending more generally. Since consumption expenditures represent two-thirds of real GDP, even a relatively modest impact from housing markets on this big sector could put a noticeable dent in overall economic activity.
Up to this point, we haven’t seen signs of such spillovers. Consumption spending has been well maintained, showing a robust growth rate for all of 2006. However, going forward, there are at least a couple of ways that spillovers from weakness in housing could depress consumer spending, and these channels bear watching. First, housing makes up a significant fraction of many people’s wealth, so a significant change in house values can affect consumer wealth and therefore consumer spending. As you know, there have been fears about plummeting house prices. But so far, at least, house prices at the national level either have continued to appreciate, though at a much more moderate rate, or have fallen moderately, depending on the price index you look at. Looking ahead, futures markets are expecting small declines in a number of metropolitan areas this year. While these modest movements are undoubtedly imparting less impetus to consumer spending now than during the years of rapid run-ups, their effects are not likely to be dramatic.
... housing market developments also could spread to consumer spending if enough homeowners experienced financial distress. For example, rising variable mortgage rates could strain some consumers’ cash flow. What we find, however, is that, because of the rapid appreciation of home prices in prior years, most homeowners are sitting on a substantial amount of equity, a financial resource that they can fall back on. In particular, adjustable-rate borrowers with equity can avoid a rate reset by refinancing. Moreover, only a small fraction of outstanding variable rate mortgages are scheduled to be reset in each of the next few years.
Of course, financial distress could be a bigger problem for some borrowers who used so-called exotic financing—like interest-only loans, piggy-back loans, and loans with the possibility of negative amortization. These instruments are often designed to allow subprime borrowers into the market. In fact, there are signs of trouble for some households. Delinquencies on variable-rate mortgages to subprime borrowers have risen sharply since the middle of last year and now exceed 10 percent. But fortunately, delinquency rates for other types of mortgages—including all prime borrowers and even subprime borrowers with fixed-rate loans—have edged up only very modestly. I know that it’s common to see newspaper stories about homeowners who have run into trouble, and those situations are, indeed, regrettable. From a national perspective, however, the group with rising delinquencies still represents only a small fraction of the total market, with little impact on the behavior of overall consumption.I've never felt housing would experience (edit) "plummeting prices" or a "devastating collapse" (note: ac points out that Yellen defines a devastating collapse as one that takes the economy into recession, so I agree that is possible), and I think that is a bit of a strawman from Dr. Yellen. But what happens when credit standards are tightened as Yellen suggests is happening? Some potential buyers are removed from the market, and demand decreases. So we currently have record levels of supply and we will probably see less demand. Does that sounds like a market that is coming into balance?
A forward-looking view of the credit risks associated with subprime mortgages can be obtained from a new financial instrument related to these mortgages. These instruments suggest a big increase in the risk associated with loans made to the lowest-rated borrowers, but little change in risk for other higher-rated borrowers. Based on these results, it appears that investors in these instruments expect the losses to be fairly well contained. Of course, a shift in market sentiment about the risk of some of these securities is always possible. Such a shift would have ramifications for mortgage financing and housing, likely through tighter credit standards and higher mortgage rates for certain borrowers. In fact, we already have seen some tightening among commercial banks in recent months.
The bottom line for housing is that the concerns we used to hear about the possibility of a devastating collapse—one that might be big enough to cause a recession in the U.S. economy—while not fully allayed have diminished. Moreover, while the future for housing activity remains uncertain, I think there is a reasonable chance that housing is in the process of stabilizing, which would mean that it would put a considerably smaller drag on the economy going forward.
I discussed the possible impact of tighter credit standards on the 2007 housing market before: Subprime: The impact on Existing Home Sales in 2007 Needless to say, I'm not as sanguine as Dr. Yellen.
MBA Purchase Applications
by Calculated Risk on 2/21/2007 12:11:00 PM
 Click on graph for larger image.
This graph shows the MBA Purchase Index since the inception of the index in 1990.
At the end of 2006 there appeared to be a surge in purchase applications. This might have been due to increased activity, or possibly favorable weather.
Another possibility is that because many smaller lenders have closed shop, more potential buyers are applying for loans from the lenders covered by the MBA survey. From the MBA:
The survey covers approximately 50 percent of all U.S. retail residential mortgage originations, and has been conducted weekly since 1990. Respondents include mortgage bankers, commercial banks and thrifts. Base period and value for all indexes is March 16, 1990=100As an example, suppose 1000 people applied for loans in a given week from 10 lenders.
Lender 1: 250
Lender 2: 150
Lender 3: 100
Lender 4-10: remaining 500 applications.
The MBA survey covers "approximately 50 percent of all U.S. retail residential mortgage originations", so in this example the MBA would only need to survey the top 3 lenders. Now if lender 10 closed shop (with 50 applicants), and the applicants all applied in equal proportions to the other lenders, the MBA index would increase 5% without any increase in overall activity.
My suspicion is this is what happened in late 2006, especially since the increased activity didn't show up in New or Existing home sales.
MBA: Mortgage Applications Decrease
by Calculated Risk on 2/21/2007 10:28:00 AM
The Mortgage Bankers Association (MBA) reports: Mortgage Applications Decrease  Click on graph for larger image.
The Market Composite Index, a measure of mortgage loan application volume, was 606.6, a decrease of 5.2 percent on a seasonally adjusted basis from 639.8 one week earlier. On an unadjusted basis, the Index decreased 2.9 percent compared with the previous week and was up 4.1 percent compared with the same week one year earlier.Mortgage rates were mixed:
The Refinance Index decreased 5.4 percent to 1921.1 from 2031.7 the previous week and the seasonally adjusted Purchase Index decreased 4.8 percent to 381.4 from 400.7 one week earlier.
The average contract interest rate for 30-year fixed-rate mortgages decreased to 6.19 percent from 6.24 percent ...
The average contract interest rate for one-year ARMs increased to 5.81 from 5.8 percent ...

The second graph shows the Purchase Index and the 4 and 12 week moving averages since January 2002. The four week moving average is down 1.3 percent to 398.7 from 404 for the Purchase Index.
The refinance share of mortgage activity decreased to 44.9 percent of total applications from 46.1 percent the previous week. The adjustable-rate mortgage (ARM) share of activity remained unchanged at 21.2 percent of total applications from the previous week.
Tuesday, February 20, 2007
NovaStar Discussion
by Calculated Risk on 2/20/2007 05:22:00 PM
From MarketWatch:
NovaStar mulls change to REIT status NovaStar Financial said late Tuesday that it's considering whether to change its Real Estate Investment Trust status after the subprime mortgage lender reported a fourth-quarter net loss.NovaStar conference call (hat tip max):
...
Problems with mortgages originated in 2006 knocked $17.4 million, or 47 cents a share, off fourth-quarter earnings. Provisions for losses on loans NovaStar has been forced to repurchase cut $13.4 million, or 36 cents a share, off results. More provisions for losses on a package of early 2006 mortgages the company securitized cost it another $10.3 million, or 28 cents a share, NovaStar said.
...
REITs have to distribute at least 90% of their taxable income as dividends. NovaStar Chief Financial Officer Greg Metz said the company expects to recognize little, if any, taxable income in 2007 through 2011, so "management is currently evaluating whether it is in shareholders' best interest to retain the company's REIT status beyond 2007 given the asset, income and other REIT-related restrictions the company must operate within."
emphasis added
Wells Fargo: Layoffs Due to Tighter Credit Policy
by Calculated Risk on 2/20/2007 04:16:00 PM
From Charlotte Observer: Wells Fargo cuts 250 jobs in Fort Mill
The cuts are the latest fallout from problems in the business of subprime lending -- lending at high interest rates. Demand for new high-rate loans is shrinking even as defaults on existing loans are rising, leaving lenders with less revenue and more expenses.
Wells Fargo, like other large mortgage lenders, has responded to the defaults by tightening the requirements for new loans, further shrinking the volume. The Fort Mill office, which is part of the company's subprime operation, will have less work to do.
"We tightened our credit policy," Wells Fargo said in a statement. "This decision directly impacts our nonprime loan volume, which in turn impacts staffing levels in the areas devoted to managing these loans."
Tanta: Mortgage Servicing for UberNerds
by Calculated Risk on 2/20/2007 12:26:00 PM
StillLearning asked in the comments about mortgage servicing, and since y’all are nerds, not dummies, here’s my highly-selective occasionally-oversimplified summary for you that skips the boring parts like how your check gets out of the “lockbox” and that stuff. We can discuss extra-credit issues like “excess servicing” and “subservicing” and “SFAS 144 meets MSR” and “negative convexity” and other kinds of inside baseball in the comments. There is a lot that can be said about loan servicing, but let’s start with the basics:
Servicers have two major types of servicing portfolio: loans they service for themselves and loans they service for other investors. In accounting terms, the “compensation” is the same, meaning that even if you are the noteholder, you pay yourself to service the loans in the same way that an outside investor would pay you, and it shows on the books that way. The differences in compensation stem from the basic fact that one is generally more motivated to do a good job servicing (particularly collecting and efficiently liquidating REO) for one’s own investment than for someone else’s.
So major investors like the GSEs have all sorts of supplemental compensation structures in place for their servicers: everyone may start out being paid just the basic servicing fee, but if you meet the GSE goals for loss mitigation and general performance standards, you get “bonuses.” Private label security servicing agreements are huge and complex, and the terms can vary. Often the way those deals provide the “extra” incentive for the servicer to do a good job is the fact that the servicer is the issuer, and the issuer retains the residual or equity tranche of the deal—so the servicer does have skin in the game when it comes to mitigating losses.
The basic economics of servicing compensation is that the servicer gets what is called a “servicing fee” on each loan equal to a slice of the interest paid. The usual servicing fee for prime loans is .25% for fixed rate and .375% for ARMs; FHA/VA loans are .44%. What you get in subprime varies widely; generally, the worse the credit quality, the more you have to pay the servicer, because the more work the servicer will do (i.e., making collection calls to get the payment in each month). ARMs are more servicing work than FRMs because the rate and payment adjustments have to be processed, notices sent, loan balances recast, etc. Servicers generally get to keep part or all of late fees (those don’t get passed on to the investor), which can create a perverse incentive: it compensates the servicer for the additional expenses of handling a delinquent loan, but it can tempt the servicer to post payments in a tardy fashion or to not bother with collection calls until after the point where a late fee is assessed to assure the fee income. The real bottom-feeder servicers make a fortune on this kind of crap. (Hence the GSEs’ “bonus” program for loss mitigation efforts: it’s a way to “reincentivize” the process so that the servicer “wins” when a troubled loan becomes current again and those late fees go away.)
The general fact about servicing fees is that they are always paid first: technically, of course, the servicer gets the payment, so the servicer gets to take its 25 or 37.5 bps off the top before passing the rest through to the investor. (There’s also non-negligible “float” income here for the servicer, as payments get collected on and around the first of the month but the “cutoff” for passing them through to the investor generally isn’t until the 25th or so.) But it’s more than just a technical fact; it’s a risk management thing, like the airline drill where passengers are advised to adjust their own oxygen mask first before assisting their children. No investor ass will be covered unless there’s a servicer to cover it, so you pay the servicer first. On the other hand, the servicer is the very first party to incur any expense in the case of delinquency or default, and the servicer’s expenses just “rack up” until final liquidation (payoff if the loan is refinanced or the property sold voluntarily, liquidation of the REO if the loan is foreclosed). Once again, though, servicer expenses come “off the top” of the liquidation proceeds, and the investor gets what’s left over.
Hence there’s always a balancing act going on between servicer and investor: if, as an investor, you want to micromanage your servicer, to make sure that it isn’t going hog wild with expenses or dragging things out until there are no proceeds left for you, you can find yourself spending too much money “redundantly servicing” loans to have any worthwhile yield left. On the other hand, if you don’t force the servicer to get your permission to take certain steps, you won’t have any yield left because the servicer eats it in expenses or throws away the property for a sweetheart price just to get the problem off the expense-o-meter.
We were talking the other day about Wells Fargo’s servicer rating being “used” to improve the rating of co-issued securities. WF is a good example of a good, conservative servicer (at least from an investor’s perspective) who doesn’t have to be babysat or argued with all the time. You very frequently do get what you pay for in this industry, and an investor might pay WF more for servicing loans, but still come out ahead of someone using some bottom-feeder servicer whose contract looks like a deal until you find out how it is going to be managed.
In any case, the other side of “float” for the servicer is the usual requirement that the servicer advance interest (and possibly principal, although that’s less common) to the investor when it is “scheduled” to be due but wasn’t actually paid by the borrower. You’ll see, for instance, the term “scheduled/actual” used to refer to a servicing arrangement. That means that the servicer must pass through all scheduled interest each month, whether collected from the borrower or not, but only actually collected principal. Most deals these days are S/A or S/S. (A/A exists, but it’s like “with recourse,” which we talked about on a prior thread. It takes a very well-capitalized, high-risk tolerance investor to accept an A/A deal; most of the ones I see these days are old Freddie Mac MBS that are down to six loans each and just won’t die until the last payment is made.)
Having to advance scheduled interest offsets the float; it’s another way to balance the incentives. It really starts to matter when we get to this thing called “nonaccrual.” Basically, a usual servicing contract will require the servicer to advance interest until the loan is more than 90 days delinquent, after which it is placed in “nonaccrual” status, meaning it is deemed uncollectable and no more interest has to be advanced. (Note: this doesn’t mean that past-due interest is “forgiven” for the borrower; it means that the investor can no longer “count” past-due interest as noncash income, because the odds of ever getting it are getting ugly.)
Even if the servicer no longer has to keep advancing scheduled interest, though, it has to keep paying property taxes and insurance, if the borrower isn’t paying it, until the property is sold. It also has to cover the other expenses in a foreclosure (unless the contract specifies that the investor or mortgage insurer will advance for certain costs) until the final payday. In practical real-world terms (not the pretty stuff you see in contracts), when recovery values in a foreclosure are high (in an RE boom), servicers can noodle along and rack up expenses you didn’t know existed—i.e., shove as much of your “overhead” into FC expenses as you can get away with, since someone else will eventually pay the tab. That’s what we mean when we say that you used to be able to make money off a foreclosure. When the liquidation value starts to approach or drop under the loan amount, on the other hand, investors and insurers start going over those expense reports with a fine-toothed comb, and it can end up in the same kind of “war” we’re seeing with repurchases.
There are two important things to know about loan servicing income in the normal (non-delinquent) side of things. One, loan balance matters to servicers in a way it doesn’t matter to investors. If you are buying, say, a $1MM interest in a $500MM pool of loans, you get the WAC (weighted average coupon or interest rate) on your million, regardless of whether that million is made up of 20 $50,000 loans or 2 $500,000 loans. Of course, if your yield is really coming from 2 $500,000 loans, you’re at much higher risk of losing yield due to refinance or principal due to default, since one-out-of-two isn’t great odds. But that’s why you’re buying a small piece of a huge pool, so you don’t have that kind of risk (the whole-loan investor has that kind of risk).
The servicer, on the other hand, gets its 25 bps for the $50,000 loan and the $500,000 loan, while its fixed costs are the same for each loan. Not only that, the fixed costs are “front-loaded” (for performing loans, remember). The big expense is getting the loan “boarded” on the servicing system, getting the initial notices out, doing the initial escrow analysis and tax setups and so on; after that (until the annual tax bills or annual ARM adjustments come into play), a performing loan is a cheap deal: payment comes in each month, gets posted, it drives itself at this point. But this means that the $50,000 loan has to stay on your books a lot longer than the $500,000 loan does for you to get past break-even, because the servicing fee/float income is a little bit a month, not an upfront lump sum. Loan officers and brokers get paid upfront lump sums for loans, so they like big loans too. Underwriters get nervous about big loans, because with loan balance increase comes credit risk increase.
So there are competing pressures—costs, risk, efficiency—in the industry regarding loan balance. In a “normal” environment, these competing pressures (servicers want the bigger loans, investors want the smaller loans) keep risks reasonably mitigated. But next time you see some statistics showing a much lower average loan balance for subprime pools, bear in mind that this isn’t just because subprime borrowers often can’t afford to borrow more. It’s because small loans have to have large servicing fees, in order to make them worthwhile for the servicer, so they have “subprime” interest rates. FHA pays 44 bps in servicing not just because their loans don’t perform as well as Fannie/Freddie loans; they also do this so that servicers will service those smaller, therefore less profitable, loans and not cut low-to-mod home-price borrowers out of the market.
The other thing is that, in direct terms, the interest rate on the loan doesn’t matter to the servicer (loan balance being equal). If I’m servicing an 8.50% loan for you, I take .25% off the top and pass through 8.25% to you. On a 4.50% loan, I take .25% off the top and pass through 4.25% to you. The servicer gets paid first, and I get my quarter and you get the rest. Indirectly, though, the servicer’s income is rate-dependent because of refinances. High-rate loans prepay faster than low-rate loans, when prevailing market prices change and the “booms” happen, so a high-rate loan is less likely to stay on the books long enough to cover costs and start generating actual profit. When market rates go up, the investor who is getting 4.25% on loans that will not refinance is losing money, because it could buy a new loan and get 8.25%. However, the servicer’s income is best in that situation, since its profitability is time-dependent, not actual yield-dependent.
This means several things. Servicing income is “counter-cyclical,” so a bank that has both a mortgage investment portfolio and a servicing platform can make money either way, if not always at the same time. Also, servicers have a built-in incentive to keep the loan going, where the investor might like to see it foreclosed. The whole uproar over servicers doing “modifications” as if it were only a way to “hide” losses misses the point that the servicer’s financial incentive is to keep getting its quarter every month. Sure, you can originate a new loan to replace the old loan, but you have those front-loaded fixed costs that don’t go away. Finally, the name of the game in servicing is “economy of scale.” The consolidation of the servicing industry from the days of Tanta’s youth to the present has been nothing short of extraordinary. The servicing market is dominated by the 800-pound gorillas, and will stay that way unless and until market incentives change or risk concentrations get so out of hand that someone has to create some “Baby Bells” out of this.
The end of the long story is that “normal” mortgage environments have lots of opposing forces in more or less equilibrium: the originator, the investor, the servicer. When the environment is not normal, distortions come in and risk levels can appear that are not “historically” usual (and everybody acts surprised). There is going to be some major whining, moaning, and gnashing of teeth by mortgage originators, should we have a real-live credit crunch, that you won’t necessarily hear from mortgage servicers, who have been taking it the shorts all these boom-years and are about to start getting profitable, assuming that delinquent-servicing costs don’t explode on them. If they have the staff to handle the FCs and BKs and REOs, it’s gravy because the investor and insurer are going to end up covering those costs as long as they’re justifiable. If you’re an inefficient servicer whose expense reports don’t pass the investor’s smell test, you’ll lose money if the REO doesn’t sell fast enough. If you’ve been puzzled about what motivates the “nuclear waste” buyers, now you know—they aren’t looking for yield on a note, they’re looking for profit on distressed-loan servicing. The reason they’re offering such crap bids is that the REO isn’t moving fast enough, which increases their expenses and thus eats into their profits. (That and the fact that the loan documents are such a giant mess in so many of these deals that it will take the Olympic Lawyer Relay Team to sort it out.)
That said, what you want to watch if you’re looking at a servicer is the category of loans that are 90+ days delinquent but not yet REO. That may not be anyone’s largest pile of delinquent loans (out of the total of 30-60-90-120-FC-REO), but it’s the one that is the expense-hole. Anyone who is letting that bucket get bigger at a faster rate than it is racking up 60-day delinquencies has a problem. Every loan that is 90 days down this month was 60 days down last month, so out-of-proportion increases in the 90+ category means that the trouble is on the liquidation (escape) side, not just the credit deterioration (entry) side: BKs or legal-document troubles are delaying foreclosure, or nobody really wants to foreclose right now because the bids are going to suck so badly. Dragging it out, though, just makes the servicer wait that much longer to get paid and eats away at what the investor will recover. It’s expensive to carry REO and market it, but you can’t list it until you own it and you can’t sell it until you list it. There are ways to win at the servicing game, but there are also many ways to lose.
WSJ: After Subprime, Danger Lurks
by Calculated Risk on 2/20/2007 02:57:00 AM
From Justin Lahart at the WSJ: After Subprime: Lax Lending Lurks Elsewhere
Investors who dabbled in subprime mortgages have learned that risk is a four-letter word. The lesson might need to be applied elsewhere before too long.My suggestion: take a hard look at CRE and C&D. When "things get ugly", defaults in CRE and C&D really increase (see early '90s on this Fed chart for commercial real estate).
...
When housing was hot, subprime mortgages seemed like a sure thing. ... The default rate has since soared.
Could this happen to other borrowers? Mortgage lenders rely on FICO scores for conventional mortgages, too. And easy money hasn't been limited to mortgages. Yields on junk bonds -- the debt of the least creditworthy companies -- have never been as low against comparable Treasury yields as now. The same is true of emerging-market debt. Defaults on these bonds are low, as they were in subprime a few years ago. But how comforting should that be?
...
The downturn has been marked by an unexpectedly large number of "early defaults," for which borrowers stop paying shortly after getting their mortgages. [Asset-backed securities research Thomas] Zimmerman sees "soft fraud" in the mix of defaults. Someone might take out a mortgage, buy a home, avoid payments and live rent-free until the marshals come.
Nobody seemed to realize the risks inherent in extending mortgages with loose standards that left borrowers with little skin in the game. The question worth asking now: Where else has lax lending been going on?
If the answer is far and wide, things could get uglier.
Monday, February 19, 2007
Kellner: Blame it on the Weather
by Calculated Risk on 2/19/2007 11:09:00 PM
From MarketWatch: It's the weather, stupid
No, Virginia, the economy did not suddenly step into a hole in the past month. Rather, it simply got stuck in a humongous pile of snow.This article makes a good point - one month does not make a trend, especially when the weather is unusually bad (or good).
There's no getting around it: The past week's slew of economic data was far from what the pundits expected. ... On the surface these developments look ominous. ...
Before you push the panic button, let me remind you that January is a notoriously bad month on which to base conclusions regarding the state of the economy. This is because it tends to be a cold, snowy month in most parts of the country, thus curtailing a wide range of economic activity, from shopping to homebuilding.
True, government statisticians adjust for these regularly-recurring declines, but when the weather is unusually rough, these seasonal adjustments cannot fully ameliorate the effects of the weather and the reported numbers take a dive.
This is what happened in the past month. Snow measured in feet rather than inches kept people out of stores and prevented them from going to work, whether to their factories or to the jobsite.
Investment Lags
by Calculated Risk on 2/19/2007 01:10:00 PM
By how many quarters does Non-residential Investment lag Residential Investment?
There are two components of non-residential investment: 1) equipment and software, and 2) non-residential structures. The following graphs shows how the YoY change in investments, in equipment and software and structures, correlates with residential investment with lag times between zero and seven quarters. Click on graph for larger image.
The highest correlation for equipment and software is a lag of 2 to 3 quarters, and for structures a lag of 4 to 5 quarters. There is a positive correlation for other periods also.
The YoY change in residential investment turned negative in Q2 2006 (quarterly residential investment turned negative in Q4 2005).
For equipment and software, investment declined in two of the last three quarters. With a lag of 3 quarters, the YoY change would turn negative in Q1 2007. Of course the lag might be longer, or YoY investment might not turn negative this time.
For non-residential structures, a lag of 5 quarters would suggest the YoY change would turn negative in Q3 2007. The quarterly change in structure investment slowed significantly in Q4 2006, but it was still positive.
Note: The correlation used data by quarter since 1960. There are 44 degrees of freedom (since some of the YoY changes are not independent). We can be 99.9% confident that residential investment and equipment and software are positively correlated, since 1960, with lags of between 1 and 4 quarters.
We can be 99% confident that the YoY change in investment in non-residential structures and residential are positively correlated with lags of between 3 and 6 quarters.
Sunday, February 18, 2007
Subprime Damage: "It is only a matter of when"
by Calculated Risk on 2/18/2007 12:39:00 PM
... the damage of the mortgage mania has been done and its effects will be felt. It is only a matter of when.From the IHT: Investors in mortgage-backed securities are failing to react to the plunge in the mortgage market. A few excerpts:
It is becoming clear, however, that subprime mortgages are not the only part of this market experiencing strain. Even paper that is in the midrange of credit quality — one step up from the bottom of the barrel — is encountering problems. That sector of the market is known as Alt-A, for alternative A-rated paper, and it is where a huge amount of growth and innovation in the mortgage world has occurred.And who are the bagholders?
[Joshua Rosner, a managing director at Graham & Fisher & Co., and Joseph Mason, associate professor of finance at Drexel University's LeBow College of Business] find that insufficient transparency in the CDO market, significant changes in asset composition, and a credit rating industry ill- equipped to assess market risk and operational weaknesses could result in a broad financial decline. That ball could start rolling as the housing industry weakens, the authors contend.
"The danger in these products is that in changing hands so many times, no one knows their true makeup, and thus who is holding the risk," Rosner said in a statement. Recent revelations of problem loans at some institutions, he added, "have finally confirmed that these risks are much more significant than the broader markets had anticipated."
Saturday, February 17, 2007
Subprime: The impact on Existing Home Sales in 2007
by Calculated Risk on 2/17/2007 02:59:00 PM
What will be the impact of tighter lending standards in the subprime mortgage market on existing home sales? First, some numbers ...
UPDATE: Here is a graph from immobilienblasen (via mish):
This graph is from Inside Mortgage Finance and shows the subprime share of the mortgage market near or over 20% for each of the last 3 years.
Original Post:
From America’s Second Housing Boom (hat tip: Blackstone):
By 2005, subprime originations had risen to $625 billion, now up to 20 percent of total originations and 7 percent of the total outstanding mortgage stock.
This is 2005 data, and other sources (and here) suggest non-prime (subprime and Alt-A) mortgage lending was about one third of all originations in 2005 and 2006.
Nonprime originations were 33% of market in 2005, up from 11% in 2003And, according to this note perhaps 25% of subprime borrowers will be unable to obtain loans in 2007:
Merrill researcher Kamal Abdullah raised the specter of a subprime "contagion" that could lead to the inability of the "bottom" 25% of all subprime borrowers to get loans.So if one fourth of potential subprime borrowers are unable to purchase homes in 2007, as compared to 2005 and 2006, then 25% of 20%, equals 5% of the total market. In 2006, there were 6.48 million existing homes sold, so 5% would be just over 300K homes.
But it's worse: The housing market is a sequence of chained reactions (just ask any agent or broker). If 300K buyers are excluded, the number of fewer houses sold in 2007, compared to 2006, is some multiple of that number. So this will probably have a significant impact on sales in 2007.
How far will sales fall?
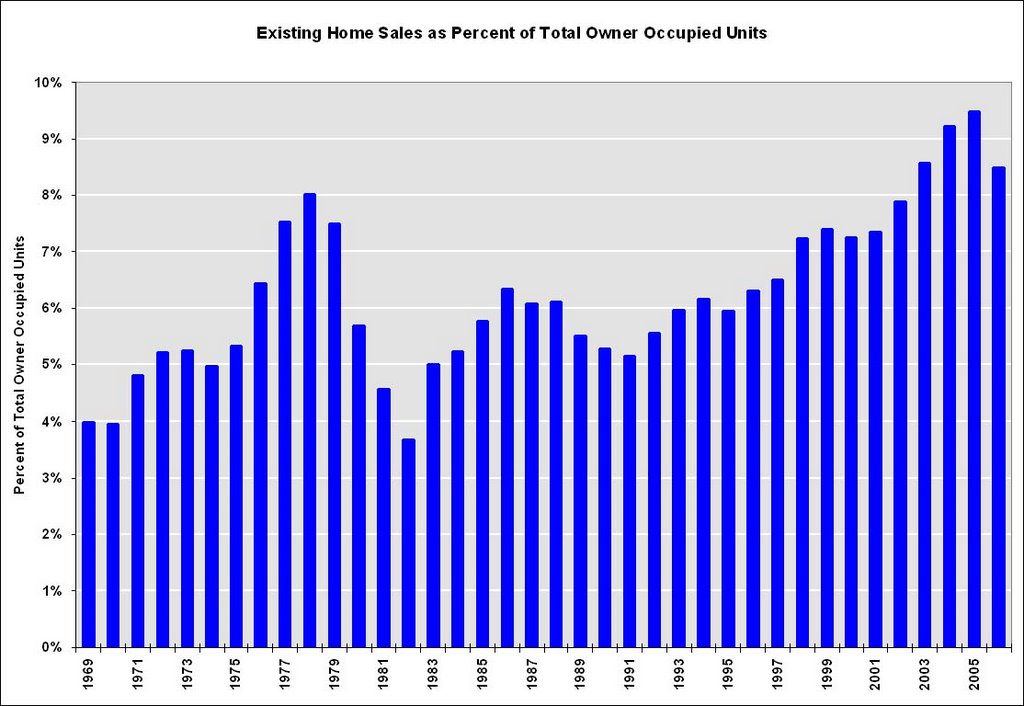 Click on graph for larger image.
This graph shows sales normalized by the number of owner occupied units. This shows the extraordinary level of sales for the last few years, reaching 9.5% of owner occupied units in 2005. The median level is 6.0% for the last 35 years.
Some of the sales were for investment and second homes, but normalizing by owner occupied units probably provides a good estimate of normal turnover. If sales fell back to 6% that would about 4.6 million units. If sales fell back to the level of 1998 to 2001 (7.3% of total owner occupied units sold) that would be about 5.6 million units in 2007.
Fannie Mae is projecting existing home sales will fall to 5.925 million units in '07. My guess is existing home sales will "surprise" to the downside, perhaps in the 5.6 to 5.8 million unit range.
Friday, February 16, 2007
Warehouse Lender Acting "Irrationally"
by Calculated Risk on 2/16/2007 04:23:00 PM
From MarketWatch: Merrill, J.P. Morgan pull back in credit crunch at low-end of mortgage market. This article is mostly a summary of recent events:
A credit crunch in the market for low-end mortgages has left companies specializing in these subprime loans at the mercy of big banks like Merrill Lynch & Co. and J.P. Morgan Chase.But this is interesting:
...
Warehouse lenders have started worrying about the quality of subprime loans that have been originated in recent years. Some are now asking subprime specialists for bigger haircuts, putting the originators in financial peril and forcing some into bankruptcy.
"Warehouse lenders are the lifelines for a lot of these subprime originators because they don't have the financial capacity to fund these loans by themselves," Ernie Napier, head of the specialty finance team at rating agency Standard & Poor's, said. "To the extent that these warehouse lenders go away, the whole process starts to unravel."
"We have eight different warehouse lenders; I would say the majority of them are acting very rationally," [Stuart Marvin, executive vice president, Accredited Home Lenders] said. "There is one that is acting somewhat irrationally, although I won't mention them by name. We have migrated the fundings away from that warehouse lender to one of the other seven until they begin to act more rationally again."Someone is acting "irrationally"? Maybe someone has taken some huge losses. Or maybe, in Mr. Marvin's view, the seven other warehouse lenders will start acting "irrationally" soon.
Industry publication National Mortgage News said this week that Merrill Lynch has been making margins calls. A Merrill spokesman declined to comment.
Wells Fargo and Subprime Loans
by Calculated Risk on 2/16/2007 02:48:00 PM
From Credit Suisse Financial Services Forum, "[Banks are] Bracing for a challenging year of EPS growth due to tepid net interest income growth and rising credit losses..." and Wells Fargo President and Chief Operating Officer John Stumpf amde it clear that "roughly 72% of the mortgage originations attributed to Wells Fargo Financial in the league tables for the 1H06 were co-issue originations."
Housing Starts and Completions
by Calculated Risk on 2/16/2007 09:11:00 AM
The Census Bureau reports on housing Permits, Starts and Completions. Seasonally adjusted permits declined:
Privately-owned housing units authorized by building permits in January were at a seasonally adjusted annual rate of 1,568,000. This is 2.8 percent below the revised December rate of 1,613,000 and is 28.6 percent below the January 2006 estimate of 2,195,000.Starts declined significantly:
Privately-owned housing starts in January were at a seasonally adjusted annual rate of 1,408,000. This is 14.3 percent below the revised December estimate of 1,643,000 and is 37.8 percent below the January 2006 rate of 2,265,000.And Completions declined slightly and are just 8% below the level of last January:
Privately-owned housing completions in January were at a seasonally adjusted annual rate of 1,880,000. This is 1.2 percentbelow the revised December estimate of 1,902,000 and is 8.0 percent below the January 2006 rate of 2,044,000.
 Click on graph for larger image.
The first graph shows Starts vs. Completions.
Starts are now at the lowest level since Aug 1997. Completions are still just 8% below one year ago, and are at about the same level as early 2005.

This graph shows starts, completions and residential construction employment. (starts are shifted 6 months into the future). Completions and residential construction employment are highly correlated, and Completions lag Starts by about 6 months.
Based on historical correlations, it is reasonable to expect Completions and residential construction employment to follow Starts "off the cliff". This would indicate the loss of 400K to 600K residential construction employment jobs by this Summer.
Thursday, February 15, 2007
CNNMoney: Record home price slump
by Calculated Risk on 2/15/2007 07:12:00 PM
From CNNMoney: Record home price slump
The slump in home prices was both deeper and more widespread than ever in the fourth quarter, according to a trade group report Thursday.Here is the NAR report: Fourth Quarter Metro Home Prices & State Sales Likely Have Hit Bottom
Prices slumped 2.7 percent in the fourth quarter compared to the fourth quarter a year earlier, according to the report from the National Association of Realtors (NAR). That's the biggest year-over-year drop on record and follows a 1.0 percent year-over-year decline in the third quarter.
I mostly use the OFHEO House Price Index, not the NAR data. OFHEO will release Q4 data on March 1st.
DataQuick: Bay Area Prices Fall, Slowest Sales Since 1996
by Calculated Risk on 2/15/2007 05:49:00 PM
DataQuick reports: Bay Area home prices edge down, slowest sales in eleven years
Home sales in the Bay Area fell for the 24th month in a row in January as prices slipped to their lowest level in a year and a half, a real estate information service reported.
A total of 6,168 new and resale houses and condos sold in the nine- county Bay Area last month. That was down 26.3 percent from a revised 8,372 in December, and down 4.1 percent from a revised 6,434 for January last year, according to DataQuick Information Systems.
A decline from December to January is normal for the season. Sales last month were the lowest for any January since 1996 when 5,504 homes were sold. The average January since 1988 has had 6,455 sales. Last month's year-over-year decline was the most moderate since March 2005 when sales fell 2.7 percent. Year-over-year sales declines peaked last July at 32.4 percent.
...
The median price paid for a Bay area home was a revised $601,000 last month, down 2.8 percent from a revised $618,000 for December, and down 1.5 percent from a revised $610,000 for January last year. Year-over-year price changes have been negative three of the last four months, ending a 57-month rise that started in December 2001. Last month's median was the lowest since $597,000 in May 2005.
S&P to Warn Earlier
by Calculated Risk on 2/15/2007 04:05:00 PM
From Bloomberg: Subprime Mortgage Bondholders to Get Earlier Warnings From S&P
Standard & Poor's said it will no longer wait for homes to be foreclosed and sold for losses before alerting investors in mortgage-backed securities that it expects to lower ratings on their bonds.And it's not just subprime:
The ratings company will now consider issuing downgrade warnings based on the amount of loans that are delinquent, in foreclosure proceedings or already backed by seized property, Robert B. Pollsen, an analyst at the firm, said on a conference
call today.
...
``It is a watershed event'' because it means S&P is now actively considering downgrading bonds within their first year and has a new program to address high levels of early delinquencies, said Daniel Nigro, an asset-backed securities portfolio manager in New York at Dynamic Credit Partners ...
One of the bonds S&P warned about yesterday was backed by Alt A -- often called ``near prime'' -- mortgages, the firm's first warning about that type of security sold last year.S&P also expressed concerns about home equity loans.
...
``In terms of performance, I'd say there are equal concerns'' about Alt A loans and subprime loans at S&P based on early delinquencies, [Ernestine Warner, an S&P analyst] said. The Alt A bond that S&P warned about was issued by Calabassas, California-based Countrywide Financial Corp., the country's top mortgage lender.
Builder Confidence Improves in February
by Calculated Risk on 2/15/2007 02:27:00 PM
 Click on graph for larger image.
The National Association of Home Builders/Wells Fargo Housing Market Index (HMI)increased from 35 in January to 40 in February, its highest level since June of 2006.
Here is the NAHB press release.
WSJ: Mortgage Hot Potatoes
by Calculated Risk on 2/15/2007 11:12:00 AM
From the WSJ: Mortgage Hot Potatoes. Excerpts:
Efforts by major banks and Wall Street firms to unload bad U.S. housing loans are speeding up a shakeout in the subprime mortgage industry.
As more Americans fall behind on mortgage payments, Merrill Lynch & Co., J.P. Morgan Chase & Co., HSBC Holdings PLC and others are trying to force mortgage originators to buy back the same high-risk, high-return loans that the big banks eagerly bought in 2005 and 2006.
Wednesday, February 14, 2007
Q4 GDP to be Revised Down
by Calculated Risk on 2/14/2007 08:09:00 PM
Rex Nutting at MarketWatch reports: Big downward revision to GDP coming
The U.S. economy was growing much slower in the fourth quarter of 2006 than the government's first estimate of 3.4%, economists say.This has been discussed at MacroBlog, The Big Picture and by Nouriel Roubini.
Instead of fairly robust 3.4% annualized growth, the government's next estimate will probably be closer to 2.2%, according to median forecast of economists surveyed by MarketWatch. Instead of bouncing back, the economy would have turned in its third quarter in a row of below-trend growth.
The first quarter also looks fairly tepid, with weak retail sales, falling homebuilding and growing signs that business investment isn't picking up the slack.
2007 Update
by Calculated Risk on 2/14/2007 05:03:00 PM
For some time I've felt the first half of 2007 was when we would start to see significant spillover effects from the housing bust into the general economy. I suggested we would see:
1) Several hundred thousand residential construction jobs lost.
Rex Nutting at MarketWatch wrote: Many layoffs coming in housing, economists say
The home-building industry collapsed in 2006, but surprisingly few workers lost their jobs, revised government data show. That could change this year, economists said.
Between December 2005 and December 2006, the number of building permits for new homes plunged 23.5%, while spending on residential construction projects fell by 12.4%. But over that time, employment in residential construction fell by just 1.4% from 3.38 million to 3.34 million. ...
 Click on graph for larger image.
This graph shows residential construction employment vs. completions and starts (Starts are shifted 6 months into the future). Part of my Housing 2007 forecast concerned the loss of 400K to 600K residential construction jobs over the first 6 months of 2007.
2) A significant decline in Mortgage Equity Withdrawal (MEW), and a negative impact on consumer spending.
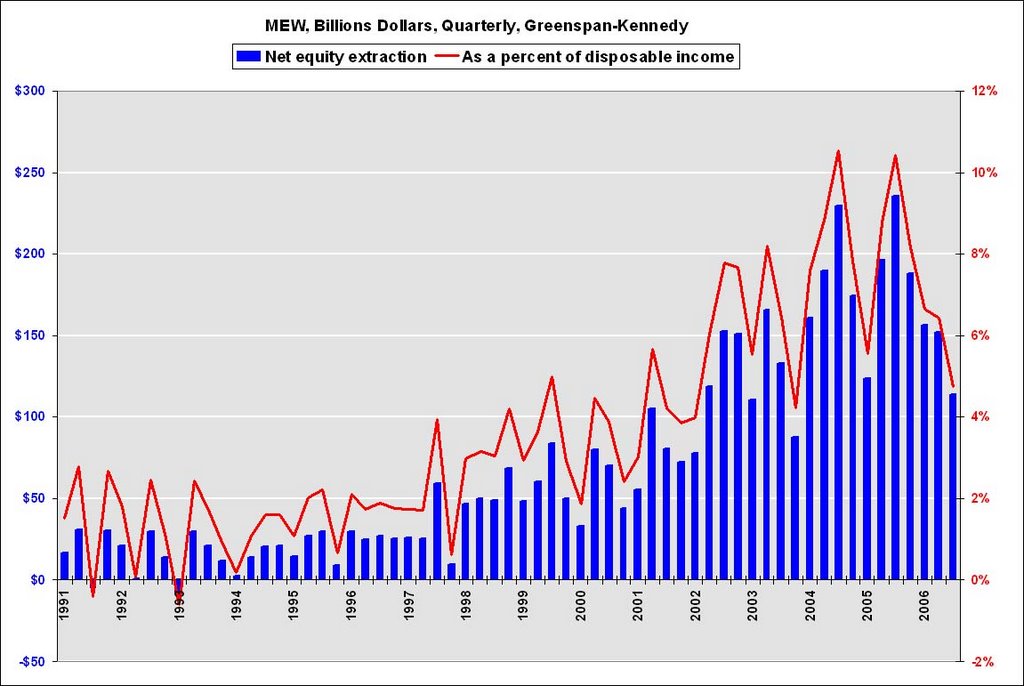 From the WSJ: Homeowners Borrow Less Against Equity in Their Homes, Data Show
 "Homeowners extracted $113.5 billion ... via mortgage refinancing and other means in the third quarter, the lowest since the fourth quarter of 2003, according to new estimates by a Federal Reserve staffer and former chairman Alan Greenspan3) Rising defaults with an impact on lenders.
That amount ... was down from $151.8 billion in the second quarter, and the high of $235.9 billion recorded in the third quarter of last year. The latest figure equals 4.7% of households' after-tax income, compared to 10.4% in the third quarter of 2005."
"We're in the midst of an adjusting market right now, and we won't know until spring or summer if this [foreclosure activity] is ominous or not,"
Marshall Prentice, DataQuick president, Jan 24, 2007
Click on graph for larger image.This graph shows Notices of Default (NOD) by year in California since 1992.
2006 had the highest number of NODs since 1998. And it now appears 2007 will see record or near record NODs.
It is now six weeks into 2007, and I think we can agree that there has already been a significant impact on mortgage lenders. We are still waiting for the other two shoes to drop ...
Accredited Home stops making riskier loans
by Calculated Risk on 2/14/2007 03:18:00 PM
From MarketWatch (hat tip: REBear): Accredited Home stops making riskier loans
Accredited Home Lenders said on Wednesday that it has stopped making some riskier types of loans as the market for low-end mortgages showed signs of a mini credit crunch.Hey, there it is ... "mini credit crunch". I was wondering when that phrase would appear in a story.
"In response to what we were hearing from the whole loan buyers, we began making adjustments to products with high combined loan-to-value ratios, products with low credit scores and products with less than full income documentation," Joseph Lydon, chief operating officer of Accredited, said during a conference call with analysts on Wednesday.
Accredited eliminated stated income loans with higher combined loan-to-value ratios (CLTVs) to borrowers with FICO credit scores of less than 640, Lydon explained. ...
The company also curtailed first-time homebuyer programs and dramatically reduced combo loan products, helping to significantly cut back second mortgage loans, he added.


