by Calculated Risk on 6/03/2007 07:32:00 PM
Sunday, June 03, 2007
Housing Update, June 2007
Here are a few simple facts:
• Housing inventories are at record levels, in both absolute terms, and as a percent of owner occupied units.
• Households are already dedicating a record percentage of their income to mortgage obligations.
• Banks are tightening mortgage-lending standards.
So what will happen to the housing market? For normal markets, these facts - excess supply, falling demand - would foreshadow falling prices. But, for housing, prices are sticky because sellers tend to want a price close to recent sales in their neighborhood, and buyers, sensing prices are declining, will wait for even lower prices.
But sticky doesn't mean stuck. Prices are now falling by most measures, and will probably continue to fall. However, in a typical housing bust, prices tend to fall slowly over several years - so buyers wait, and transaction volumes also decline.
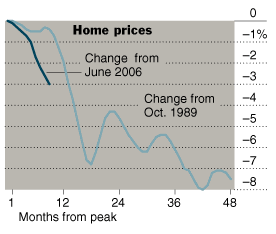
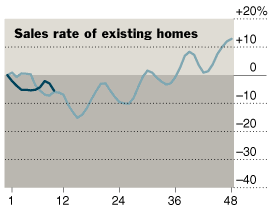
Writing in the NY Times, Floyd Norris does an excellent job of discussing the dynamics of a housing bust: The Long Life Span of a Housing Downturn (See article for more graphics).

If the current bust follows the '89 pattern, prices will decline in the index cities for another 3 years. However, the recent boom was far greater than the late '80s boom, and this bust might also be worse. Some of the hardest hit markets following the '89 bust were Los Angeles and Hartford; prices declined in both markets for more than 6 years, and the total price declines were 21% and 15% respectively in nominal terms.
One thing that was very different at the 1989 peak from the one in 2006 was the trend in the number of homes being offered for sale. When prices peaked in 1989, the number of homes for sale was already declining, and it continued to fall for some months, perhaps reflecting decisions by homeowners to hold on and wait for prices to come back.
 Click on graph for larger image.
This graph shows sales and inventory normalized by the number of owner occupied units. As Norris noted, inventory was flat or falling in '89, but inventory is increasing rapidly and is at an all time high.
Note: all data is year-end except 2007. For 2007, the April sales rate and inventory are used. For owner occupied units, Q1 2007 data from the Census Bureau housing survey was used for April 2007.
NOTE: In the article, Norris mentions that inventories are at record levels, but his numbers are incorrect. He wrote:
... the latest report shows that more than 4.1 million homes were for sale at the end of April, the largest number ever. That included almost 3.6 million existing homes, also a record high.Actually the total is 4.7 million with 4.2 million existing homes for sale. From the NAR:
Total housing inventory rose 10.4 percent at the end of April to 4.20 million existing homes available for sale ...Another stark difference between '89 and today is that transaction volumes are still near record highs as a percent of owner occupied units. In '89, sales had already fallen below the normal turnover level - meaning sales probably wouldn't fall much more. In the near future, it is very likely that the turnover rate for existing homes will fall back to more normal levels, putting even more pressure on prices.
In '91, the months of supply peaked at 8.1 months (end of '91, some months were higher), and currently the months of supply is already at 8.4 months. If turnover falls back to normal levels, there might be a full year or more of supply on the market.
On to the homebuilders:
Existing homes are a competing product for new homes, so for the homebuilders, all this inventory spells P-A-I-N. There is a substantial amount of excess inventory on the market - my estimate was 1.1 to 1.4 million units - Gary Shilling's estimate was over 2 million units.
 So far the homebuilders have only cut starts back to about 1.5 million units (Seasonally Adjusted Annual Rate, SAAR).
Back in January, Fannie Mae chief economist David Berson wrote:
We have argued for some time that the surge in housing demand in recent years ... was unsustainable. Understandably, builders responded to this pickup in overall housing demand by significantly increasing house construction. As a result, too many housing units were built in recent years relative to the underlying pace of housing demand-- bringing unsold inventories up to record highs. But how large is this overhang relative to long-term housing demand?Berson calculated the overhang at 600K (this appears to be far too low based on Census Bureau vacancy rates). Berson used 1.8 Million units per year as a steady state demand; I used 1.7 million units. This number is important, because if the builders are still starting 1.5 million units per year, and the overhang is say 1 million units (just an example, probably too low), then it will take 5 years to work off the excess inventory.
To work off the excess inventory in just a couple of years, housing starts need to fall much further - perhaps to about 1.1 million SAAR. However the builders find themselves with serious cash flow problems. They have too much land (remember the ludicrous "land bank" comments from a couple of years ago?), but they can't sell the land. Hovanian just noted:
[Land sales have] "just really slowed to a complete trickle with very few buyers of any type out there"So the builders have to build spec houses, and then discount the prices to get any money for their land. This keeps the inventory levels high and prolongs the housing slump.
In conclusion, the outlook for housing remains dismal.


