 RSS Feed
 by Calculated Risk on 10/20/2006 05:15:00 PM
Friday, October 20, 2006
Housing Starts, Completions and Construction Employment
On Wednesday the Census Bureau released the September report for housing Permits, Starts and Completions. Although Starts rebounded slightly from the rate in August, from a long term perspective Starts are in free fall.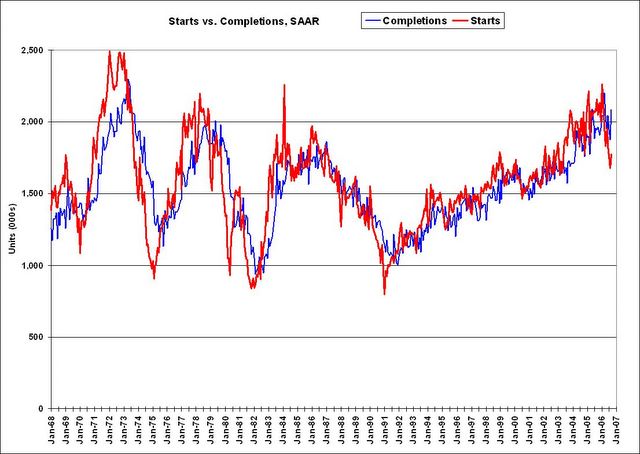 Click on graph for larger image.
At this point in the housing cycle, Completions are more interesting than Starts. As the first graph shows Completions follow starts with about a 6 to 12 month lag.
For data on the time between Starts and Completions, see Length of Time For New Residential Construction
In September, Completions were at a seasonally adjusted annual rate (SAAR) of 2,084,000. Some of these Completions were for rental units and some were built directly for the owner. The breakdown on the completions by intent isn't available yet from the Census Bureau for Q3. But based on Q2 data, we can estimate that 73% were built for sale, or approximately 1.52 million (SAAR). Since sales are running close to a SAAR of 1.05 million units (and probably less because of cancellations), that means about 1/3 of the units completed in September were added to inventory. Completions are also interesting because Residential Construction employment is closely correlated with Completions. The second graph shows Completions vs. Residential Construction employment over the last 6 years.
Based on the current level of New Home sales, it appears about 600K residential construction employment jobs will be lost over the next few of years. However based on completions, residential construction employment is about right.
And that takes us back to the first graph: Since Starts peaked in early '06, and have been in free fall since then (with an insignificant bounce in Sept), completions, and therefore residential construction employment, will probably start declining rapidly soon.


