 RSS Feed
 by Calculated Risk on 12/30/2005 02:51:00 PM
Friday, December 30, 2005
Broken Promises
One of my predictions for top economic stories for 2006 concerned problems with pension plans. From the LA Times today: How Bedrock Promises Of Security Have Fractured Across America
...That's when Delphi Chief Executive Robert S. "Steve" Miller, citing global competition and crippling "legacy costs," ushered the $28.6 billion-a-year company into one of the largest industrial bankruptcies in U.S. history. In short order, Miller called for slashing workers' compensation by almost two-thirds, threatened to void the company's union contracts, and hinted broadly that he would follow the playbook he had used elsewhere of pushing responsibility for paying the firm's pensions to the federal government and dumping its retiree health benefits altogether.An excellent article. I was once the trustee of a retirement plan and I will write about my experiences in the new year.
Although Delphi has since backed off a bit — it says it's willing to negotiate with its unions and its former parent and largest customer, General Motors Corp. — the parts firm has left little doubt that its ultimate aim remains steep reductions in wages, benefits and retiree costs.
Delphi is at the cutting edge of a crisis that's engulfing the U.S. auto industry, much as it did steel and airlines. Its actions are adding to a gathering trend, a shift of economic risks once largely borne by business and government to the backs of working families.
Before the trouble is over, some believe, a corporate icon such as Ford Motor Co. or GM could be swept from the American landscape. So too could much of what remains of the already frayed relationship between millions of working people and their employers.
"When the history of this period is written, Delphi will be viewed as the tipping point where the auto industry either got its act together or failed," said David E. Cole, the son of a former GM president and head of the Center for Automotive Research, based in Ann Arbor, Mich. "The spillover to the rest of the economy is going to be tremendous."
Thursday, December 29, 2005
Snow: Raise Debt Limit
by Calculated Risk on 12/29/2005 06:47:00 PM
Reuters reports: Snow urges Congress to raise debt limit U.S. Treasury Secretary
John Snow warned lawmakers on Thursday that a legally set limit on the government's ability to borrow will be hit in mid-February and urged Congress to raise it quickly.
...
"The administration now projects that the statutory debt limit, currently $8.184 trillion, will be reached in mid-February 2006," Snow said in a letter to 21 members of the U.S. House of Representatives and Senate released by Treasury after financial markets had closed.
...
The debt limit was last raised in November 2004 by $800 billion to its current level. The letter to Congress does not specify an amount the Treasury wants the ceiling set at this time.
...
Treasury officials had said in November it was bracing for hefty borrowing needs in the January-March quarter, likely around a record $171 billion, and that it likely would hit the debt limit in that period.
Existing Homes: Sales Fall, Inventory Increases
by Calculated Risk on 12/29/2005 11:23:00 AM
The National Association of Realtors (NAR) reports: Existing-Home Sales Trend Lower in November
Total existing-home sales – including single-family, townhomes, condominiums and co-ops – eased 1.7 percent to a seasonally adjusted annual rate of 6.97 million units in November from a pace of 7.09 million in October. Sales were 0.1 percent below the 6.98 million-unit level in November 2004.Inventories increased to a 5 month supply:
Total housing inventory levels rose 1.2 percent at the end of November to 2.90 million existing homes available for sale, which represents a 5.0-month supply at the current sales pace.This represents a 14% increase from November 2004, when the inventory of existing homes was 2.54 million.
Just a note for next month: Inventories usually fall in December as sellers take their houses off the market for the holidays.
Wednesday, December 28, 2005
Looking Forward: 2006 Top Economic Stories
by Calculated Risk on 12/28/2005 07:10:00 PM
First, here are a few stories that I don't think will be big in 2006:
1) Energy Prices: I expect oil prices to stabilize or decline next year. WTI spot prices closed at $59.96 today. This prediction could be wildly wrong, especially if production falls at Ghawar or the US bombs Iran. This prediction is based on the increased level of investment, the current levels of crude oil stocks and a slowing World economy in 2006.
2) Bush Economic proposals: I think the Bush Administration will be shackled by scandals and Iraq, so I don't expect any major new proposals. I hope I'm wrong about Iraq.
3) Trade Deficit / Current Account Deficit: I could be wildly wrong here too, but I think the trade deficit will stabilize or even decline slightly next year. As the economy slows, I think imports will slow.
4) The Budget Deficit: Although I expect the General Fund deficit to grow to around $600 Billion in 2006, I don't think it will become a huge story until '07 or '08.
So, without trying to predict natural disasters, a pandemic or human stupidity (terrorism, bombing Iran, etc.), I think these are five possible candidates for the top economic stories of 2006:
5) The End of the Greenspan Era
OK. I'll start with a gimme. I think Dr. Bernanke will face a significant challenge in '06, perhaps by one the following top stories - perhaps by something completely unexpected. Stephen Roach recently wrote:
"Alan Greenspan faced a stock-market crash two months after he took over in August 1987. Paul Volcker had to cope with a rout in the bond market three months after he became chairman in August 1979. G. William Miller was challenged immediately by a dollar crisis in the spring of 1978. For Arthur Burns, it was the inflation bogie in the early 1970s."When the challenge comes, expect investors to pine for their lost love: Alan Greenspan.
4) Housing Slowdown
In my opinion, the Housing Bubble was the top economic story of 2005, but I expect the slowdown to be a form of Chinese water torture. Sales for both existing and new homes will probably fall next year from the records set in 2005. And median prices will probably increase slightly, with declines in the more "heated markets".
3) Pension Blowup / Major Bankruptcy
Of course I am thinking GM, but maybe it will be another major corporation. Bankruptcy has become a tool to break labor agreements and terminate pension plans. This allows companies to "privatize profits and socialize risk" - and companies will increasingly use this tool.
Even "freezing" the pension plan has enormous consequences for many employees, since a large portion of the retirement benefit is accrued in the last few years before retirement. See the USAToday article: Pension problems loom for boomers.
2) Slowing Economy
If the US and the World economies slide into recession, this will be the top story next year. I still think it is too early to call, but I do think economic growth will slow substantially next year.
This slowdown will be partially housing related; as housing slows, real estate related employment will decline and jobs could become an issue in '06. Also, as mortgage equity withdrawal declines, consumer spending will slow.
And my prediction for the Top Story of '06:
1) Interest Rates
Like most investors, I expect the Fed to raise the Fed Funds rate 25 bps at each of the next two meetings to 4.75% in March. See Dr. Altig's graphs: An Inversion Arrives
And like many observers, I expect the Fed to start lowering rates later next year as the economy slows. But here is the surprise, I think long rates will start to rise when the Fed starts cutting the Fed Funds rate.
This will be Bernanke's "conundrum"! As the economy slows, this will reduce the trade deficit and also lower the amount of foreign dollars willing to invest in the US - the start of a possible vicious cycle.
I couldn't resist going out on a limb ... or a couple of limbs. Its fun making predictions - I'm looking forward to the comments.
Best to all. Happy New Year!
MBA: Mortgage Activity Declines
by Calculated Risk on 12/28/2005 10:49:00 AM
The Mortgage Bankers Association (MBA) reports: Mortgage Application Activity Slows Preceding Holiday Weekend
The Market Composite Index - a measure of mortgage loan application volume was 554.1 -- a decrease of 6.8 percent on a seasonally adjusted basis from 594.6 one week earlier. A holiday adjustment was included in the seasonally adjusted numbers to help account for the reduced application activity prior to the holiday weekend. On an unadjusted basis, the Index decreased 17.0 percent compared with the previous week and was up 3.1 percent compared with the same week one year earlier.Rates were steady:
The seasonally-adjusted Purchase Index decreased by 4.5 percent to 432.9 from 453.1 the previous week whereas the Refinance Index decreased by 11.2 percent to 1259.1 from 1418.1 one week earlier.
The average contract interest rate for 30-year fixed-rate mortgages decreased to 6.21 percent from 6.22 percent on week earlier ...Activity is falling, but still reasonably strong. These reports will be more informative after the holidays.
The average contract interest rate for one-year ARMs decreased to 5.36 percent from 5.41 percent one week earlier...
Tuesday, December 27, 2005
Looking Back: 2005 Top Economic Stories
by Calculated Risk on 12/27/2005 01:09:00 AM
Looking back, I think these were the Top Five economic stories of 2005:
5) Social Security
Social Security is the story of what didn't happen.
Drs. Mark Thoma, Brad DeLong, Paul Krugman, Andrew Samwick and my friends at Angry Bear all contributed to my understanding of this issue.
4) Interest Rates
The Federal Reserve raised the Fed Funds Rate eight times in 2005; steadily increasing the rate at a measured pace (25 bps) after each Federal Reserve meeting. The Fed Funds rate started the year at 2.25% and finished at 4.25%.
The eight increases might be a big story in and of itself, except the even bigger story was Greenspan's "conundrum" with long rates. The Ten Year Treasury Note started the year yielding 4.22% and closed last week yielding 4.38%.
Amazing.
Looking ahead: It appears the yield curve will officially invert after the next Fed Meeting (Jan 31, 2006 - Greenspan's last meeting).
For more on the Fed, I suggest reading Dr. Tim Duy and Dr. William Polley.
3) Energy Prices
Another huge story was energy prices. Even though prices have dropped recently, oil and gasoline prices are substantially higher than last year. According to the DOE, at the end of 2004, the weighted average price was $32.07 per barrel (all grades) and $51.58 last week. That is a 61% increase in the price of crude oil.
For Energy issues, see Dr. James Hamilton.
2) Trade Deficit
The trade deficit continued to increase in 2005. For the Jan through Oct period, the US trade deficit was $598 Billion, up from $504 Billion for the comparable period in 2005. The US is heading for a $720+ Billion trade deficit for 2005, or close to 6% of GDP.
For more, see Dr. Brad Setser and Dr. Menzie Chinn.
And the biggest story of the year ...
1) The Housing Bubble
I've written extensively about housing on this blog and at Angry Bear. For daily updates, I've linked to several sites on the right under "Housing Sites".
I'll write a "looking forward" to 2006 post later this week. Note: Iraq and Katrina were also huge stories in 2005 from an economic perspective, as were hurricanes in general and global warming. Iraq is a huge story from many perspectives, but I am trying to stick to macroeconomics.
Best to all. Happy New Year!
Friday, December 23, 2005
November New Home Sales: 1.245 Million Annual Rate
by Calculated Risk on 12/23/2005 10:11:00 AM
According to the Census Bureau report, New Home Sales in November were at a seasonally adjusted annual rate of 1.245 million vs. market expectations of 1.30 million. October's record sales were revised down slightly to 1.404 million from 1.424 million.
Click on Graph for larger image.
NOTE: The graph starts at 700 thousand units per month to better show monthly variation.
The Not Seasonally Adjusted monthly rate was 85,000 New Homes sold, down from a revised 110,000 in October.
On a year over year basis, November 2005 sales were 1% higher than November 2004.
The median and average sales prices are trending down.
The median sales price of new houses sold in November 2005 was $225,200; the average sales price was $283,300.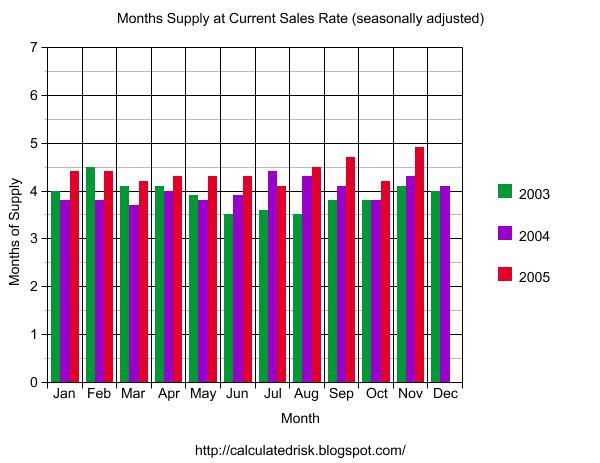
The seasonally adjusted estimate of new houses for sale at the end of November was 503,000. This represents a supply of 4.9 months at the current sales rate.
The 503,000 units of inventory is the all time record for new houses for sale. On a months of supply basis, inventory is above the level of recent years.
This report is still reasonably strong.
Thursday, December 22, 2005
West Coast Ports: November Imports Mixed, Exports Up
by Calculated Risk on 12/22/2005 03:01:00 PM
The Ports of Long Beach and Los Angeles reported mixed import traffic for October.
Import traffic at the Port of Long Beach increased 2.0% compared to October. A total of 305 thousand loaded cargo containers came into the Port of Long Beach, compared to 299 thousand in October. The record is 313 thousand set in August 2005.
The Port of Los Angeles import traffic decreased 11% in November. Imports were 325.1 thousand containers, off from the record set in October for the Port of Los Angeles of 368.5 thousand containers.
For Long Beach, outbound traffic was up 3.6% to 107 thousand containers. At Los Angeles, outbound traffic was flat at 98 thousand containers.
The quantity of containers says nothing about the content value, but provides a rough guide on imports from China and the rest of Asia. Given these numbers, I expect imports from Asia to be about the same in November as in October.
Wednesday, December 21, 2005
Martin Wolf Podcast: The surprises of the past year
by Calculated Risk on 12/21/2005 09:05:00 PM
From the Financial Times, Martin Wolf discusses the world economy:
Wolf's discussion starts a little slow, reciting a number of growth statistics, however the second half of the podcast regarding global imbalances is interesting.
MBA: Mortgage Application Volume Down
by Calculated Risk on 12/21/2005 10:38:00 AM
The Mortgage Bankers Association (MBA) reports: Mortgage Application Volume Down In Latest Survey
The Market Composite Index — a measure of mortgage loan application volume was 594.6 -- a decrease of 4.0 percent on a seasonally adjusted basis from 619.3 one week earlier. On an unadjusted basis, the Index decreased 5.2 percent compared with the previous week and was down 15.2 percent compared with the same week one year earlier.
The seasonally-adjusted Purchase Index decreased by 5.2 percent to 453.1 from 477.9 the previous week, whereas the Refinance Index decreased by 1.6 percent to 1418.1 from 1441.8 one week earlier.

Click on graph for larger image.
The graph shows overall and purchase activity since June. Overall activity has fallen significantly due to the drop in refis.
Mortgage rates decreased slightly again last week:
The average contract interest rate for 30-year fixed-rate mortgages decreased to 6.22 percent from 6.28 percent on week earlier ...Overall this report shows purchase activity might be weakening, but it is still at a very high level.
The average contract interest rate for 15-year fixed-rate mortgages decreased to 5.76 percent from 5.83 percent ...
Tuesday, December 20, 2005
New Proposed Guidance on Nontraditional Mortgage Products
by Calculated Risk on 12/20/2005 01:28:00 PM
From the FDIC: Federal Financial Regulatory Agencies Propose Guidance on Nontraditional Mortgage Products
UPDATE: I think this paragraph has the most teeth:
Collateral-Dependent Loans – Institutions should avoid the use of loan terms and underwriting practices that may result in the borrower having to rely on the sale or refinancing of the property once amortization begins. Loans to borrowers who do not demonstrate the capacity to repay, as structured, from sources other than the collateral pledged are generally considered unsafe and unsound. Institutions determined to be originating collateral-dependent mortgage loans, may be subject to criticism, corrective action, and higher capital requirements.This is essentially a warning not to rely on the value of the property to bail out the home buyer. The teeth are "criticism, corrective action, and higher capital requirements.", with the higher capital requirements being the only significant penalty.
The Press Release:
The federal financial regulatory agencies today issued for comment proposed guidance on residential mortgage products that allow borrowers to defer repayment of principal and sometimes interest.Interagency Guidance on Nontraditional Mortgage Products
These nontraditional mortgage products include "interest-only" mortgage loans where a borrower pays no principal for the first few years of the loan and "payment option" adjustable-rate mortgages where a borrower has flexible payment options, including the potential for negative amortization. Institutions are also increasingly combining these mortgages with other practices, such as making simultaneous second-lien mortgages and allowing reduced documentation in evaluating the applicant’s creditworthiness.
While innovations in mortgage lending can benefit some consumers, the agencies are concerned that these practices can present unique risks that institutions must appropriately manage. They are also concerned that these products and practices are being offered to a wider spectrum of borrowers, including subprime borrowers and others who may not otherwise qualify for more traditional mortgage loans or who may not fully understand the associated risks of nontraditional mortgages.
The proposed guidance discusses the importance of carefully managing the potential heightened risk levels created by these loans. Toward that end, management should:
* Assess a borrower’s ability to repay the loan, including any balances added through negative amortization, at the fully indexed rate that would apply after the introductory period. The agencies recognize that this requirement differs from underwriting standards at some institutions and are specifically requesting comment on this aspect of the guidance.
* Recognize that certain nontraditional mortgage loans are untested in a stressed environment and warrant strong risk management standards as well as appropriate capital and loan loss reserves.
* Ensure that borrowers have sufficient information to clearly understand loan terms and associated risks prior to making a product or payment choice.
Comment is requested on all aspects of the guidance, particularly on the section regarding comprehensive debt service qualification standards. Comments are due sixty days after publication in the Federal Registrar. The guidance is attached.
Monday, December 19, 2005
Real Estate: Is the party over?
by Calculated Risk on 12/19/2005 08:52:00 PM
CNN Money asks: Is the party over?
The article includes "exclusive forecasts" for the 100 largest markets.
... the overall outlook seems reasonable: 7 percent appreciation for 2006 and flat for 2007. But markets that have seen the greatest appreciation over the past five years appear to be vulnerable.Check out the table at the bottom of the article. I think some of these projections are a little optimistic. Will San Antonio home prices increase 15% over the next two years? Will Boston stay flat, even with 8+ months supply (and growing)?
Indeed, at some point in the next two years, according to the forecast, a third of the nation's 100 largest metro areas (accounting for 60 percent of the U.S. population) are expected to see modestly falling house prices.
Real estate bear markets often come in the form of steady declines over many years, rather than sudden sharp drops.
As inflation gradually gnaws away at the value of nominal home prices, regular folks might not take much notice. But in the long run the loss of wealth becomes all too real. From 1989 to 1997, for instance, Los Angeles residential real estate dropped more than 40 percent in inflation-adjusted terms.
The nation's most perilous regional market, according to the forecast data: Las Vegas, a speculator-infested hot spot. Prices there are projected to deflate by 7.9 percent next year, the year after by another 5 percent. For newcomers to the market and those with low-money-down deals who may have overleveraged themselves with adjustable-rate mortgages, even a modest downturn could mean financial jeopardy.
Home Builders Confidence Falls
by Calculated Risk on 12/19/2005 03:13:00 PM
Please see Angry Bear for National Association of Home Builders HMI excerpts and links to historical tables.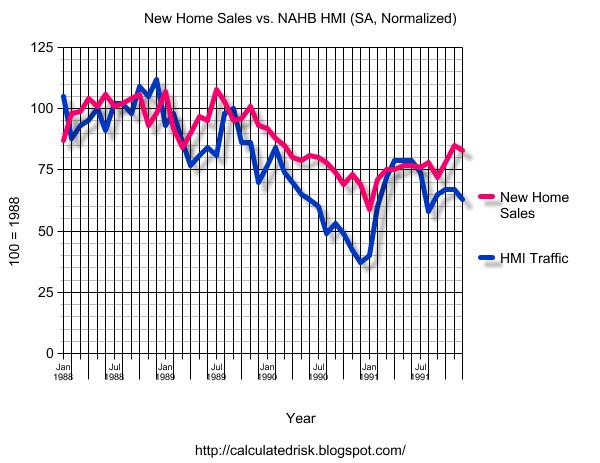
Click on graph for larger image.
This graph shows New Home Sales vs. the NAHB traffic index from 1988 to 1991. Both series are seasonally adjusted and are normalized to 1988 = 100.
It appears that the NAHB index was generally a coincident indicator for New Home Sales in the previous housing slowdown.
With the fall in the NAHB HMI, I expect a similar fall in New Home Sales on Friday.
Sunday, December 18, 2005
Comments on End of Housing Boom
by Calculated Risk on 12/18/2005 03:40:00 PM
From Knight Ridder: Boom likely over in housing market. The article contains comments from FDIC Chief Economist Richard Brown and Federal Reserve Bank of Chicago Senior Economist Richard Rosen.
...homeowners will no longer be able to use houses as piggybanks, cashing in on gains in appreciation periodically through low-cost refinancings. And many will be forced to hold on to a house or condominium for a long time as they wait for prices to rise.And from Federal Reserve Bank of Chicago Senior Economist Richard Rosen:
The problem is that rising mortgage rates are putting an end to the easy money that underpinned increasing home prices, said Richard Brown, chief economist of the Federal Deposit Insurance Corp. in Washington.
"Price increases have far outstripped income growth for a long time, particularly in the last two years, but that period is coming to an end," he said.
The so-called golden age for mortgage lending is about over after lasting about 20 years, he said.
"The end of the boom probably is not far away," Brown said. "It likely will lead to a long period of price stagnation, but not technically a bust."
Home prices "have been rising far more rapidly than rents for the last four years. This probably is what Federal Reserve Chairman Alan Greenspan meant when he pointed to froth in the housing market," said economist Richard Rosen of the Federal Reserve Bank of Chicago.Note: this article was orginally published on Dec 9th.
He said a huge drop in long-term mortgage rates since 1985, when they were around 12 percent, to a recent rate near 5 percent "meant that you could afford more house for the same monthly payment."
Rosen compared the United States with Britain, where mortgage rates have been rising for about two years. Here, the uptick in rates began later.
"In Britain, if housing was a bubble, it didn’t burst," he said. "When mortgage rates rise, prices flatten, but they may not actually decrease."
One warning sign for the housing market, Rosen said, is that more and more owners are putting property on the market, and real estate is taking longer to sell.
"The risk is that if sales slow, there will be too much supply, creating price risk," he said.
WaPo: Agents Aplenty
by Calculated Risk on 12/18/2005 01:58:00 AM
From the Washington Post: Agents Aplenty Career-Jumpers Looking For Easy Commissions Made a Low-Percentage Play
The story is interesting, especially these facts:
Seduced by the housing boom and its promise of ever-higher prices with ever-bigger sales commissions for agents, the number of licensees in Maryland, Virginia and the District has just about doubled in the past six years, according to local licensing agencies, with the Northern Virginia real estate association adding about 300 new agents a month. Nationally, the number of licensees was at a record high of more than 2.5 million at the end of 2004.The previous post showed the increase in agents for California. It appears the D.C. area had a similar increase. But now that the market appears to be slowing:
... a slowing of the market could have big consequences. When the housing market slumped the last time, about 20,000 salespeople and brokers in Maryland jumped ship from 1990 to 2000, regulators said.
Craig Cheatham, chief executive of the Association of Real Estate License Law Officials, said, "I think by now that, with the number of people who are out there in real estate, there are a lot of people who are not making money."
But the NAR says its surveys show that real estate never has been "something you get rich quick in," said spokesman Walter Molony. In its latest survey, in August, those in the business for two years or less earned only $12,850. However, for those with more experience, the past two years were very good. Those with six to 10 years' experience earned a median $58,700, up 18.6 percent from 2002. Those who had at least 26 years earned $92,600, up 37.2 percent.
Friday, December 16, 2005
The Real Estate Agent Boom
by Calculated Risk on 12/16/2005 05:34:00 PM
One thing with housing is certain, the Real Estate agent boom continues unabated. 
Click on graph for larger image.
This graph shows the number of licensed Brokers and salespeople in California for each November.
The California Department of Real Estate reports the total number of agents in California is now 471,818, up 1.1% from last month, and up 13.7% from last November.
Also California's EDD reported today for November:
Within nonfarm industries, nine sectors saw month-over seasonally adjusted job gains and two sectors saw month-over job declines. Sectors with increased employment, in order of job gain, were:The good news is the state added jobs in a number of sectors, but construction employment is still the strongest sector - even during a period when, according to the EDD: "It is not unusual to see [construction employment] soften towards the end of the year."
Construction (8,000);
Trade, transportation and utilities (7,900);
Professional and business services (7,200);
Information (6,100);
Financial activities (1,300);
Leisure and hospitality (1,300);
Manufacturing (500);
Other services (300); and
Natural resources and mining (100).
Social Security: Responding to Criticism
by Calculated Risk on 12/16/2005 02:28:00 PM
A couple of blogs have responded to my post dismissing the Samwick, et. al. Social Security proposal. Let me reiterate, I respect Professor Samwick's intentions, but I think his efforts are misdirected.
The first blogger, Arnold Kling at Econlog writes:
Even if one were to accept the premise that the fiscal problem is larger elsewhere, this is a phony argument. CR is acting like an angry teenager, sticking his fingers in his ears and saying "I'm not listening to you."Skipping over Kling's personal attacks, Kling is completely wrong - both about my suggestions and about the underlying economics.
But the premise is also wrong. If we allocated a larger share of payroll taxes to Medicare instead of SS, we could argue that Medicare is not a problem but SS is the big issue. We should be looking at the challenge of funding spending as a whole, not looking at the arbitrary allocation of taxes to different programs. In terms of overall spending, Social Security is a gigantic issue.
Finally, it is disingenous to whine that we need to solve the other problems first, without offering a solution. Overall, this stance of "solve X and Y before you tackle Z" comes across to me as mere demagogic rhetoric, the end result of which will be that X, Y, and Z will remain unsolved.
First, although not included in my Social Security post (for brevity), just last week I wrote that there is good news for reforming health care in America:
... there is hope for the health care system. Currently the US has the most expensive health care system per capita in the World, and some of the worst outcomes for a first world nation. This offers an opportunity to reform the US healthcare system, and luckily there are several examples of systems that provide better outcomes for substantially lower costs. (See Angry Bear's and Kash's posts on the left under Topics: The U.S. Healthcare System)So I'm not suggesting moving money from bucket A to bucket B; I'm actually suggesting reforming the entire system and dramatically cutting the costs and improving outcomes.
But Kling really goes astray when he suggests looking at "spending as a whole". The real issue in all of these debates is who pays the taxes and who receives the benefits.
As a mental exercise, imagine if we eliminate SS spending and the SS payroll tax - what happens? The General Fund deficit stays exactly the same and we would need to address the significant General Fund shortfall. Would Kling then suggest raising taxes on lower and middle income Americans to cover the shortfall? That seems to be Kling's suggestion.
So I believe we want to do the exact opposite of what Professor Kling suggests; for some programs we want to analyze each program and revenue source separately.
Two Lenses
One of the skills of a successful executive is to be able to manage with two lenses: a wide angle lens (to see the big picture) and a telephoto lens to zoom in on problems. But just like a photographer, the executive needs to know when to use each lens.
Its not that I'm "not listening", I'm prioritizing.
I believe there is no need to discuss the details of Professor Samwick's proposals; the wide angle lens shows Social Security is irrelevant.
Thursday, December 15, 2005
DataQuick: Southland home sales strong, prices hit new peak
by Calculated Risk on 12/15/2005 07:19:00 PM
DataQuick reports: Southland home sales strong, prices hit new peak
Southern California home sales remained at near- record levels last month as prices continued their climb to new heights ...
A total of 27,637 new and resale homes were sold in Los Angeles, Riverside, San Diego, Ventura, San Bernardino and Orange counties last month. That was down 3.0 percent from 28,489 in October, and up 0.6 percent from 27,459 for November last year, according to DataQuick Information Systems.
A decline from October to November is normal for the season. The strongest November in DataQuick's statistics was in 1988 when 29,303 homes were sold. The slowest November was in 1991 when 13,537 homes were sold. So far this year 326,746 Southland homes have been sold, virtually unchanged from 326,880 for the first eleven months of last year.
...
The median price paid for a Southern California home was $479,000 last month, a new record. That was up 1.3 percent from $473,000 in October, and up 15.4 percent from $415,000 for November 2004. Annual price increases have been in the mid teens since April.
...
The typical monthly mortgage payment that Southland buyers committed themselves to paying was $2,238 last month, up from $2,169 for the previous month, and up from $1,830 for November a year ago. Adjusted for inflation, current payments are about the same as they were in the spring of 1989, at the peak of the prior real estate cycle.
DataQuick: Slower Bay Area home sales, steady price increase
by Calculated Risk on 12/15/2005 07:16:00 PM
DataQuick reports: Slower Bay Area home sales, steady price increase
Bay Area home sales continued to slow on a year-over-year basis while prices continued to climb, a real estate information service reported.
A total of 9,717 new and resale houses and condos were sold in the region last month. That was down 7.5 percent from 10,508 for October, and down 10.8 percent from 10,897 for November last year, according to DataQuick Information Systems.
...
Last month was the third-strongest November.
...
The median price paid for a Bay Area home was $625,000 last month, a new record. That was up 1.8 percent from $614,000 in October, and up 17.3 percent from $533,000 for November a year ago. Annual price increases so far this year have ranged from 17.2 percent to 20.5 percent.
...
The typical monthly mortgage payment that Bay Area buyers committed themselves to paying was $2,921 in November. That was up from $2,815 in October and $2,350 for November last year. Adjusted for inflation current payments are 16.5 percent higher than at the peak of the last real estate cycle in the spring of 1990.
Indicators of market distress are still largely absent. Foreclosure rates are low, down payment sizes are stable and there have been no significant shifts in market mix, DataQuick reported.
Fiscal Challenges, Social Security and Changing the Debate
by Calculated Risk on 12/15/2005 02:22:00 PM
From Professor Samwick at Vox Baby:
Along with Jeff Liebman of Harvard University and Maya MacGuineas of the New America Foundation, I am pleased to announce the "Nonpartisan Social Security Reform Plan."My response was blunt:
Professor, I appreciate your efforts, but ...Ranking the Challenges
The two most pressing fiscal challenges for the US are: 1) the health care system and 2) the General Fund Deficit (close to $600 Billion this year alone).
Social Security is irrelevant when compared to those two problems.
I suggest fixing the most serious problems FIRST, and then returning to Social Security.
Any good manager would 1) measure the problem and then 2) solve the largest problems first. With that approach, here are the three largest fiscal challenges facing the United States:

Click on graph for larger image.
This chart shows the relative sizes of the three major fiscal challenges over the next 75 years. The NPV for the General Fund deficit is based on deficits equal to 5% of GDP. Note: the fiscal 2006 general fund deficit will be close to 5%.
The estimates for Medicare and Social Security are from the GAO report (pdf): The Long Term Fiscal Challenge
From the GAO report:
"Health care is a bigger problem than Social Security. Participants acknowledged the need for Social Security reform but emphasized that Social Security is a relatively small part of the long-term fiscal challenge when compared to spending on health care. ... Several participants observed that few members of the public are aware of this. Rather, the general public impression is that solving Social Security would solve most of the longterm fiscal challenge, and this is not correct.And on the General Fund deficit:
"Participants agreed that a key moral context is the impact federal budget deficits will have on future generations."Conclusion
The debate should be focused on the two major issues: Health Care and the General Fund deficit. Without addressing those issues first, reforming Social Security is irrelevant.
Housing: OC Real Estate Roundtable
by Calculated Risk on 12/15/2005 11:07:00 AM
The Orange Country Register sponsored a roundtable on real estate this week. The participants included "economists, real estate executives, consultants, a researcher and a broker" and the comments were unsurprisingly mostly positive.
This discussion of exotic loans was interesting:
... the panelists weighed in on risks and benefits of creative financing, prospects of widespread foreclosures, and solutions to the housing crunch.I think there will be additional factors impacting the economy if housing prices flatten. Not only will some recent buyers be at risk of foreclosure, but there will be less employment in RE related industries and less equity extraction to fund consumer spending and home improvement projects.
The prevalence of easy money is a concern, and much of it originates in Orange County, according to Scott Simon, who heads the mortgage investment team at the Pimcobond firm in Newport Beach.
"This is the hub of creative credit in the world," Simon said.
Simon said some lenders have dramatically increased the amount of interest-only loans they make in recent years. The trend has helped increase the percentage of Americans who own homes, but has led to a number of buyers borrowing too much, he said.
A day of reckoning for some buyers could be in the offing, according to Simon and some other panelists.
Several panelists said homeowners most at risk of foreclosure are those who bought homes since 2003, have no equity, and have adjustable mortgages with very low rates. Most buyers before 2003 have built up a fat cushion of home equity to fall back on if mortgage rates rise, they said.
The number of homeowners at risk of foreclosure probably is in the range of 7,000 to 8,000, said Chris Cagan, director of research and analytics with First American Real Estate Solutions in Santa Ana. That total would represent 7 percent to 8 percent of local buyers over the past two years, he said.
Cagan said that if all of those at risk defaulted, it would add about two months' supply of homes for sale to the market, not enough to sink it.
Wednesday, December 14, 2005
Economist: Can America keep it up?
by Calculated Risk on 12/14/2005 06:13:00 PM
The Economist is amazed by the American consumer:
FOR several years now, economists have been watching American consumers with the same mixture of astonishment and anticipation that wide-eyed fans bring to endurance sports: amazing that they’ve made it so far, but how much longer can they go on like this? Strong consumer spending has underpinned America’s robust economic expansion, even as most other industrialised countries have struggled to get their economies back on track. But consumers have been running down savings to sustain this level of spending; the personal savings rate has actually been negative since June. Booming house prices and low interest rates have enabled consumers to take on more debt without suffering much, but with interest rates now climbing, Americans have begun to feel the pinch. Data from the Federal Reserve show that the percentage of household disposable income devoted to servicing debt was a record 16.6% in the third quarter.A nice summary article.
Yet the consumers soldier on.
PIMCO's Gross: Housing Could Stop Fed Course Short
by Calculated Risk on 12/14/2005 04:55:00 PM
The Orange County Business Journal quotes PIMCO's Bill Gross:
"Housing in the next month or two will display extreme weakness, and the Fed will stop,"The short article adds:
Gross, Pimco's chief investment officer, predicts a rate cap of 4.5%, though others see at least two more hikes by the Federal Reserve.Two predictions to check back on in a couple of months.

Click on graph for larger image.
According to Dr. Altig's calculations, the Fed Funds Futures shows at least two more rate hikes. This is a regular feature at Macroblog.
Right now I think hikes to 4.5% in January and 4.75% in March are likely. Although I agree with Gross that the end of the rate hikes is near.
MBA: Mortgage Refinance Applications Continue To Decline
by Calculated Risk on 12/14/2005 10:40:00 AM
The Mortgage Bankers Association (MBA) reports: Refinance Applications Continue To Decline
Market Composite Index — a measure of mortgage loan application volume was 619.3 -- a decrease of 5.7 percent on a seasonally adjusted basis from 656.7, one week earlier. On an unadjusted basis, the Index decreased 8.1 percent compared with the previous week and was down 11.0 percent compared with the same week one year earlier.
The seasonally-adjusted Purchase Index decreased by 3.5 percent to 477.9 from 495.1 the previous week whereas the Refinance Index decreased by 9.7 percent to 1441.8 from 1596.4 one week earlier.

Click on graph for larger image.
The graph shows overall and purchase activity since June. Overall activity has fallen significantly due to the drop in refis. Purchase activity is steady.
Mortgage rates decreased slightly last week:
The average contract interest rate for 30-year fixed-rate mortgages decreased to 6.28 percent from 6.32 percent on week earlier ...Overall this report shows purchase activity is steady at a very high level.
The average contract interest rate for 15-year fixed-rate mortgages decreased to 5.83 percent from 5.84 percent ...
Tuesday, December 13, 2005
October U.S. Trade Deficit at Record $68.9 Billion
by Calculated Risk on 12/13/2005 08:48:00 PM
The U.S. Census Bureau and the U.S. Bureau of Economic Analysis reports that the U.S. trade deficit for October was $68.9 Billion. Imports increased to a record $176.4 billion from $171.8 Billion in September.
Click on graph for larger image.
The October record was the result of the significant increase in imports and only a small increase in exports.
Imports from China set another record of $24.4 Billion, while exports to China increased slightly to $3.9 Billion. Imports from Japan increased to $12.2 billion from $10.9 Billion in September.
The Petroleum deficit set another record of $24.2 Billion, up from the previous record of $22.3 Billion in September. The increase in the petroleum deficit was mostly due to a 25% surge in the import of refined products that added almost $2 Billion to the October deficit.
November retail sales fall short
by Calculated Risk on 12/13/2005 01:24:00 PM
Reuters reports:
U.S. retail sales rose a smaller-than-expected 0.3 percent in November and fell when a surge in auto purchases was excluded, setting the stage for what could be a disappointing holiday shopping season, government data showed on Tuesday.I hope these two posts make the retail outlook clear.
Sales of motor vehicles and parts rose for the first time since July, surging 2.6 percent. But without the auto sales, retail demand fell 0.3 percent, the Commerce Department said. That was the first decline since April 2004.
...
"A report like this will continue to fuel the debate about how strong consumer spending will be over the holiday season," said Alan Gayle, a managing director at Trusco Capital Management in Atlanta.
...
Much of the weakness in November's sales was due to a 5.9 percent drop in sales at gasoline stations -- a direct result of the decline in gas prices last month and hardly bad news for consumers.
...
"Excluding autos, spending growth looks healthy -- not a blockbuster holiday season, but far better than it appeared a couple of months ago when gasoline prices were over $3 per gallon," economist Nigel Gault said.
When the drop in sales at gasoline stations is excluded, retail sales rose 1.0 percent in November.
October sales were also revised higher, helping take some sting out of the disappointing result. Total sales rose 0.3 percent that month, up from the 0.1 percent decline initially reported.
...
Still, with October and November sales weaker than expected, analysts said there could well be an outright decline in retail sales in the fourth quarter -- which in turn would hurt economic growth in the final three months of 2006.
"This was a disappointing number relative to expectations and certainly consistent with the idea that consumer spending is going to be a much smaller contributor to economic growth in the fourth quarter than in the third," said Chris Probyn, chief economist at State Street Global Advisors in Boston.
...
"Seasonal business remains below expectations," Redbook said. "An early-December lull was factored into most sales plans for the month, so retailers remained cautiously optimistic as they continued to sit out the pre-Christmas wait."
NRF: Strong November Retail Sales Surpass Expectations
by Calculated Risk on 12/13/2005 11:06:00 AM
The National Retail Federation reports:
Consumers started their holiday shopping with a bang, responding well to retailers' aggressive promotions. According to the National Retail Federation (NRF), retail industry sales for November (which exclude automobiles, gas stations, and restaurants) rose a strong 7.4 percent unadjusted over last year and increased 0.5 percent seasonally adjusted from the previous month. The increase is in line with NRF's holiday sales forecast of 6.0 percent growth.
"Consumers shook off concerns about higher energy costs and responded well to the seasonal promotions," said NRF Chief Economist Rosalind Wells. "If November is any indication of what consumers are capable of, retailers can expect a very happy holiday season."
November retail sales released today by the U.S. Commerce Department show that total retail sales (which include non-general merchandise categories such as autos, gasoline stations and restaurants) rose 0.3 percent seasonally adjusted from November, and increased 6.3 percent unadjusted year-over-year. Gasoline sales, which NRF does not include in its calculation of retail industry sales, rose 17.0 percent unadjusted from last November.
The rosy report was boosted by strong year-to-year growth across nearly every retail industry category, including building material and garden equipment and supplies stores, which jumped a whopping 14.3 percent over last year. The main drivers for this holiday, apparel and electronics, also experienced solid growth. Sales at clothing and clothing accessories stores rose 7.6 percent year-over year and electronics and appliance stores jumped 7.4 percent from November 2004.
Additionally, strong year-over-year gains were seen at health and personal care stores (6.7%), general merchandise stores (7.1%), furniture and home furnishing stores (5.9%) and grocery stores (5.3%).
NRF expects retail industry sales to increase 5.6 percent this year over 2004. Holiday sales, which are defined as retail industry sales in the full months of November and December, are expected to rise 6.0 percent to $438.5 billion.
Monday, December 12, 2005
Household Debt Service and "Parabolic Debt"
by Calculated Risk on 12/12/2005 05:00:00 PM
Reuters quotes Prudent Bear fund manager David Tice expressing concern today that 'credit market debt as a percent of U.S. gross domestic product "has essentially gone parabolic"'.
I'm more concerned that Household Debt Service is at an all time high, even with low interest rates. See my Angry Bear post: FED: Household Debt Service Sets Record in Q3
First, here are some quotes from the Reuters article:
A possible hard landing for the U.S. housing market poses the risk of a secular bear market for equities, mutual fund manager David Tice said on Monday at the Reuters Investment Outlook 2006 Summit.
"The rollover in real estate could happen pretty quickly," said Tice, who runs the the Prudent Bear, a mutual fund which seeks to benefit from falling share prices.
The United States has leaned heavily on housing and related industries for economic growth in recent years.
That virtuous circle, fueled by rounds of cash-out mortgage refinancing that has propped up consumer spending, will give way in 2006 or 2007 to a vicious cycle that drags down corporate earnings and employment, he said.
...
"The excesses in mortgage finance are just astounding," he said at the summit, which is being held in New York this week.
...
Years of cheap credit provided by an accommodative Federal Reserve has made more difficult the task of running a bear fund and picking the right stocks to short, Tice said.
...
Tice said credit market debt as a percent of U.S. gross domestic product "has essentially gone parabolic," and policy-makers have seemed prepared to prevent recession at all costs.
"If you continue to goose the economy with more debt it's like keeping an eight-year-old on a sugar high," he said.

Click on graph for larger image.
Tice is referring to all debt, but it might be helpful to look at the fastest growing segment; mortgage debt. This graph shows the growth of mortgage debt as a % of GDP since 1999.
Although mortgage debt has grown substantially, both nominally and as a % of GDP, I wouldn't call it "essentially ... parabolic".
I think the greater concern is the recent rise in household debt service and financial obligations ratios. Both ratios are already at record levels.
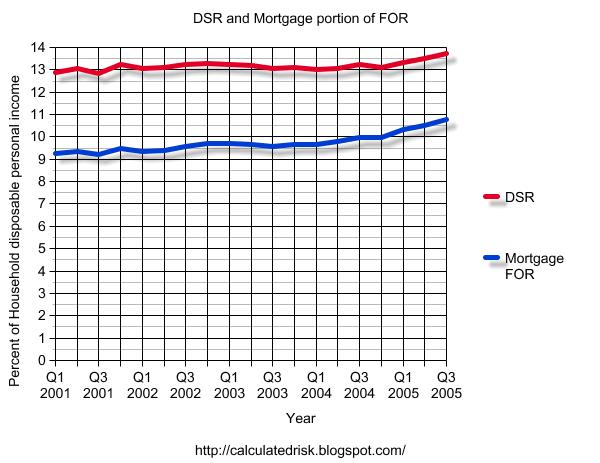
DEFINITIONS: The household debt service ratio (DSR) is an estimate of the ratio of debt payments to disposable personal income. Debt payments consist of the estimated required payments on outstanding mortgage and consumer debt.
The financial obligations ratio (FOR) adds automobile lease payments, rental payments on tenant-occupied property, homeowners' insurance, and property tax payments to the debt service ratio.
Note: The graph only shows the mortgage portion of the FOR.
It appears households initially took on debt and kept their payments steady as interest rates dropped. However, recently the portion of disposable personal income dedicated to debt service has risen steadily. As interest rates rise, and with the new credit card minimum payments, the DSR and FOR will probably continue to rise, putting more pressure on household finances.
Saturday, December 10, 2005
GDP Growth: With and Without Mortgage Extraction
by Calculated Risk on 12/10/2005 12:39:00 AM
The recent Flow of Funds report showed that household mortgages increased a record $289.5 Billion in Q3 2005. Using a simple formulation for Mortgage Equity Withdrawal (MEW), MEW was $171 Billion in Q3. Note: to calculate MEW, I simply subtracted new single family construction spending from the increase in household mortgages. This is close to other methods.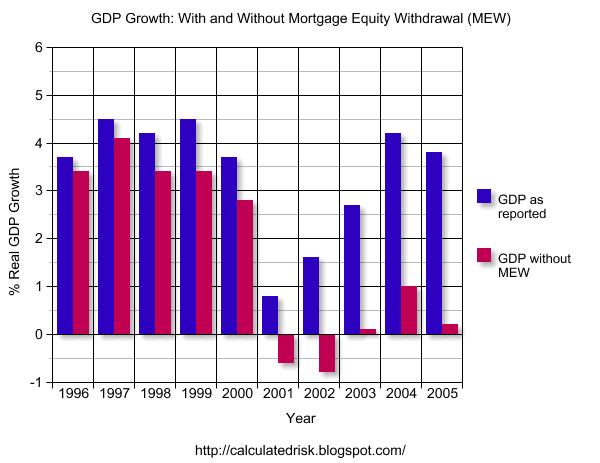
Click on graph for larger image.
Using Goldman's estimate of about 2/3 of MEW flowing through to personal consumption expenditures, it is possible to estimate the impact of MEW on GDP. Note: Some estimates are only about 50% of MEW flows through to consumption.
The graph clearly shows the importance of MEW over the last few years. For 2005, I used YTD compared to 2004.
Many observers estimate that MEW will fall significantly in the next few years. If so, this will be a drag on GDP as the growth of personal consumption expenditures slows.
The two most direct impacts of a housing slowdown are:
1) the loss of housing related employment.
2) lower MEW and the impact on personal consumption expenditures.
Earlier I posted two articles on the loss of housing related employment:
LA Times: Mortgage Industry Job Losses May Rise With Interest Rates
CNN: There go 800,000 jobs out the door
A significant drop in MEW will lead to the loss of retail related employment too.
Friday, December 09, 2005
Minimum-Payment Loans Get Maximum Crackdown
by Calculated Risk on 12/09/2005 07:27:00 PM
The WaPo reports: Minimum-Payment Loans Get Maximum Crackdown
Federal financial regulators appear to be on the verge of reining in one of the most popular mortgages in hot housing markets nationwide -- loans that allow 1 percent to 2 percent payment rates leading to "negative amortization."The author is basing this article on John Dugan's remarks last week (Comptroller of the Currency).
UPDATE: I linked to the wrong speech ... here is the correct one:
For excerpts see: Remarks by John C. Dugan, Comptroller of the Currency
And here is the complete text of Dugan's remarks (pdf).
The bottom line for 2006: Look for tougher standards on popular 1 percent and 2 percent minimum-payment plans, and fewer qualified buyers in high-cost markets where wild appreciation has been sustained in part by reality-bending rate-reduction programs
Housing and Jobs
by Calculated Risk on 12/09/2005 03:18:00 PM
The LA Times reports: Mortgage Industry Job Losses May Rise With Interest Rates
As interest rates have risen, refinancings have faded and applications for loans to purchase homes have begun to decline, according to the Mortgage Bankers Assn.And the impact from these job losses could ripple through the economy:
Many borrowers already have taken out equity from their homes through refinancings and second mortgages. If home prices level off, as many predict, these homeowners will have less equity to extract and less incentive to refinance.
Mortgage Bankers Assn. economist Doug Duncan said jobs would be lost as some companies pared their staffs and others were acquired or went out of business. The number of job reductions will depend on how high rates go, he said, with as many as 80,000 positions eliminated should 30-year fixed rates climb to 8.25%, up from 6.32% currently.
In addition to layoffs, experts also expect a shakeout in the ranks of mortgage brokers, the independent loan originators whose numbers have swollen along with the home-lending boom that began in 2001.
These brokers aren't counted in the payroll surveys conducted by the government. John Marcell, president of the California Assn. of Mortgage Brokers, believes that they now total about 25,000 in the state, but predicts that's about to change radically as ill-trained brokers who got into the business during the boom now find it harder to make a living.
"I would say probably half of what's out there today could wash out," Marcell said.
By reducing spending power and demand for office space, the loss of mortgage jobs can cause ripple effects through local economies like Orange County's. Ryan Ratcliff, an economist for the Anderson Forecast at UCLA, said studies of the early 1990s recession showed that regions with large employment in the mortgage industry were hurt disproportionately in economic downturns.When I first started looking at the housing market, I wrote this on Angry Bear: After the Housing Boom: Impact on the Economy. So far employment and mortgage equity withdrawal are still solid, but those are areas to watch closely.
Best of Times II
by Calculated Risk on 12/09/2005 12:37:00 AM
For a related post, see Kash's: The Role of Spending Growth in the Deficit
Many people think of the "Baby Bust" as the period right after the "Baby Boom". The real Baby Bust happened from 1925 to 1939. See this animation:
This has important implications for policy. Those people born between 1925 and 1939 are now 66 to 80 years old - the peak years for receiving retirement benefits.
The Baby Boomers are 40 to 60 - their peak earning years.
So these are the Best of Times for fiscal policy: fewer than the normal percentage of the population are recipients of elderly social programs, and a larger than normal percentage are in their peak earning years.
Social Security should be running a large surplus, and it is!
Medicare should be running a large surplus, but it is only breaking even.
The Federal Government should be running a large surplus, but it is running a large deficit.
From the prespective of demographics, the US Government needs to address the General Fund deficit NOW. America also needs to reform the health care system. These are the two most pressing long term fiscal issues for America.

Thursday, December 08, 2005
Household Valuation Change: FED vs. OFHEO
by Calculated Risk on 12/08/2005 09:11:00 PM
With the release of the Flow of Funds report today, I decided to compare the FED's estimate of the total value of household real estate with the OFHEO House Price Index (HPI). Of course OFHEO only reports the nominal change in house prices, so the comparison is really between the changes in valuation (either annually or quarterly).
I thought this might be interesting, mostly to see if there is a difference between the two approaches. The FED reports the total valuation of household real estate. This includes any new stock put into place and improvements to existing stock. OFHEO reports the change in the price of existing stock.
To compute the annual change for the FED for existing stock, I started with year N. For year N+1, I subtracted construction estimates from the Census Bureau of new private single family construction and improvements.
Click on graph for larger image.
The first graph shows the annual change from both the FED (subtracting new construction as above) and the OFHEO HPI. Clearly both methods yield similar results and I don't see any systemic bias either way.
The second graph is for the last seven quarters, and shows the quarterly change for both sets of data.
Once again both methods yield similar results with no discernible bias. This gives me a little more confidence in both data sets, unless the FED uses the OFHEO HPI as part of their calculation!
FED: Q3 Mortgage Debt increased at 14% Annual Rate
by Calculated Risk on 12/08/2005 12:16:00 PM
The FED Flow of Funds report was released today. It shows that household mortgage debt increased at a 14% annual rate in Q3, 2005.
On a dollar basis, household mortgage debt increased by an all time record $289.5 Billion in the 3rd quarter. The last 7 quarters (billions increase in household mortgages):
q1 2004: $190.4
q2 2004: $211.1
q3 2004: $277.1
q4 2004: $223.5
q1 2005: $176.5
q2 2005: $263.7
q3 2005: $289.5
The debt story continues.
Wednesday, December 07, 2005
MBA: Mortgage Application Volume Rebounds
by Calculated Risk on 12/07/2005 12:03:00 PM
Following the negative predictions from Dr. Leamer and the Anderson forecast, the MBA reports that mortgage applications rebounded and are still near record territory (seasonally adjusted).
UPDATE: Long term MBA graph courtesy of ILD:
Click HERE for larger image.
The Mortgage Bankers Association (MBA) reports: Mortgage Application Volume Rebounds

The Market Composite Index — a measure of mortgage loan application volume was 656.7 -- an increase of 5.2 percent on a seasonally adjusted basis from 624.1, one week earlier. On an unadjusted basis, the Index increased 46.8 percent compared with the previous week [Thanksgiving holiday] but was down 6.1 percent compared with the same week one year earlier.
The seasonally-adjusted Purchase Index increased by 4.0 percent to 495.1 from 476.2 the previous week whereas the Refinance Index increased by 7.0 percent to 1596.4 from 1484.3 one week earlier.

Click on graph for larger image.
The graph shows overall and purchase activity since June. Overall activity has fallen significantly due to the drop in refis. Purchase activity is steady.
Mortgage rates increased last week:
The average contract interest rate for 30-year fixed-rate mortgages increased to 6.32 percent from 6.20 percent on week earlier...Overall this report shows purchase activity is steady at a very high level.
The average contract interest rate for 15-year fixed-rate mortgages increased to 5.84 percent from 5.72 percent...
Dr. Leamer: Housing Slowdown May Claim 800,000 Jobs
by Calculated Risk on 12/07/2005 11:52:00 AM
From the AP: Housing Slowdown May Claim 800,000 Jobs
A sustained decline will hit the U.S. housing market next year, costing the nation as many as 800,000 jobs, according to a new economic report released Wednesday.
The slowdown is likely to last several years, with as many as 500,000 construction jobs and 300,000 financial sector positions lost, the quarterly Anderson Forecast predicted.
"We expect housing to start slowing the economy this quarter or the next," said Edward Leamer, director of the study done at the University of California, Los Angeles.
"Some jobs in manufacturing might well disappear as a result of weakness in housing, but this may be offset by jobs brought home or not lost to foreign competition," he wrote.
The forecast said eight of the last 10 economic recessions were started by housing market slowdowns. Though the coming cooldown will cause a drag on the nation's economy, it will fall short of triggering a recession, the forecast said.
The report cited several signs that the decline could be under way:
• New construction of housing in October was down 5.6 percent from the previous month, with new construction of single-family housing accounting for a 3.7 percent dip.
• New home sales have declined.
• Applications for home mortgages have trended downward since late September as rates increased.
• In some regions, homes are remaining unsold longer and the pace of housing construction is outpacing population growth, which could spell a decline in demand.
"On all these grounds, we believe housing is due for a sustained decline," economist Michael Bazdarich wrote in the forecast. "The remaining questions are how hard the fall will be and when it will begin."
Tuesday, December 06, 2005
Housing Bubble Bursts in U.S. Mortgage Bond Market
by Calculated Risk on 12/06/2005 11:46:00 AM
Bloomberg reports: Housing Bubble Bursts in U.S. Mortgage Bond Market
Bonds backed by home loans to the riskiest borrowers, the fastest growing part of the $7.6 trillion mortgage market, have lost about 2.5 percent since September on concern an 18-month rise in interest rates may force more than 150,000 consumers to default.This is really no surprise. Many marginal buyers used excessive leverage (a type of speculation) to purchase a home. They were hoping that continued home price appreciation would bail them out, if their personal financial situation did not improve.
``We've been hearing about risks of a house price bubble, easy credit and loans to borrowers that really don't qualify, and now in the last couple of months we're starting to see things turn for the worse,'' said Joseph Auth, a bond fund manager who helps oversee $135 billion at Standish Mellon Asset Management in Boston. ``We don't know if it's going to be a hard or soft landing.''
...
The slump in the bonds is one of the first signs the housing boom is ending after the Federal Reserve's 12 interest- rate increases. Real estate has accounted for about half the economy's growth since 2001, according to Merrill Lynch & Co.
...
About 13.4 percent of all mortgages at the end of June were to borrowers considered most likely to default, such as those with high credit card balances, up from 2.4 percent in 1998, according to the Mortgage Bankers Association. The Washington- based trade group's 2,700 members represent 70 percent of the home-loan business.
The amount of bonds backed by these high-risk loans has more than doubled since 2001, to a record $476 billion, according to the Bond Market Association, a New York-based trade group of more than 200 securities firms.
The market ``will deteriorate as housing slows down,'' said Christopher Flanagan, who runs asset-backed debt research at New York-based JPMorgan Chase & Co., the fourth-largest mortgage lender in the U.S. The amount of loans made next year may fall by as much as 25 percent, he said.
...
The last time delinquency rates on lower-rated mortgages jumped was in 2000 as economic growth slumped following the Fed's six rate increases. The central bank has lifted rates 12 times since June 2004, to 4 percent from 1 percent.
...
Delinquencies tend to peak two to three years after subprime loans are originated, said Glenn Costello, an analyst at Fitch Ratings in New York. Peak rates of about 20 percent to 25 percent now will likely rise to the high-20s in 2006, he said.
...
Lenders that rushed to provide mortgages amid rising home prices are now stuck with loans worth less than they expected because bond investors are demanding more protection. They are raising mortgage rates help to make up the difference.
...
``In a rapidly changing environment, you can find yourself ahead or behind the yield curve,'' Robert Cole, chief executive officer of New Century, the No. 2 lender to people with the lowest credit scores, said in a Nov. 15 interview in New York. ``With rates going up, it's more likely behind.''
Even if home prices just flatten out, many of these marginal buyers will be in trouble. And the mortgage bond market is reflecting that fear.
Monday, December 05, 2005
Massachusetts: Foreclosure rates on the rise
by Calculated Risk on 12/05/2005 05:32:00 PM
The Sentinel & Enterprise reports: Foreclosure rates on the rise
David Anderson has seen his share of families facing trouble with late bills and expensive mortgages, as a counselor for people about to lose their homes.I think this is key: people are getting in trouble, not because of a personal emergency, but because they are simply over their heads in debt.
But lately Anderson, who works for a Gardner-based Residential Assistance Transitional Housing, got a surprise -- a big jump in foreclosures in the area.
"It used to be that people in foreclosures find themselves in a catastrophic situation, something medical or a losing a job," Anderson said. "But it seems to be now I get a lot of desperate calls from first-time homeowners who have done a 20-80 mortgage or a zero interest mortgage, what some would call predatory lending."
Homeowners across the state are losing their homes at a growing rate, forcing lawmakers to face a hard reality on Beacon Hill -- the state's economy is far from a healthy recovery.
The number of foreclosures in Massachusetts has increased by more than 33 percent in the past year.
...
Economists who spoke to the Sentinel & Enterprise expect the trend to continue as long as the state's economy, particularly job growth, remains sluggish.
"There has been a confluence of events: very slow job growth and higher interest rates, have all conspired to have this one particular result of (more) foreclosures," Nakosteen said.
Bob Forrant, a professor in the regional economic and social development department at UMass Lowell, said foreclosures are on the rise because high real estate prices and loose mortgage requirements clashed with a lack of well-paying jobs in the state.
"The state is not generating enough well-paying work ... and people have been buying more house than they can afford," he said.
...
William Wheaton, an economist and professor at the Massachusetts Institute of Technology in Cambridge, said the spike in foreclosures is "not an economy thing."
"The economy is improving, not very dramatically, but we are on a recovery," Wheaton said.
Wheaton blames the national lending explosion, where more people than ever before had been able to qualify for a mortgage.
"It used to be that you had to have good credit to get a mortgage, but now no matter who you are, you can get a mortgage," he said. "You get a huge number of young people able to buy homes, but they are at a very high risk (of defaulting on loans) ... so the foreclosure rates there will be very high. It won't be getting any better for awhile."
Wheaton also said tougher federal bankruptcy laws, which went into effect in October, will make it harder for people to escape major debt and leave people stranded with high payments and possibly lose their homes.
Demographics and Policy
by Calculated Risk on 12/05/2005 12:26:00 AM
My Angry Bear post builds on my previous demographic posts: The Best of Times. The post includes an enhanced animation of the demographic changes from 1900 to 2050 (based on Census Bureau projections).
Recommended:
Dr. Duy's Fed Watch: Looking for a Reason to Worry ...
And excerpts from Paul Krugman's: Joyless Economy
"It should have been a good year for American families: the economy grew 4.2 percent ... Yet most families actually lost economic ground. Real median household income ... fell for the fifth year in a row. And one key source of economic insecurity got worse, as the number of Americans without health insurance continued to rise. ..."I believe this story of a bifurcating US economy is important. In the roaring 20's many families were struggling because of increased productivity on farms (due to the farm tractor). This shows up in the demographic numbers - the start of the Baby Bust was before the start of the Depression.
The improved farm productivity (a good thing) contributed to a period of depressed wages for a large segment of America (a bad thing) and was a factor in the Great Depression. It really is important that a rising tide floats a vast majority of boats. That didn't happen in the 20's and its not happening now.
Best to all.
Sunday, December 04, 2005
Barrons on Housing
by Calculated Risk on 12/04/2005 09:27:00 PM
Barrons opines on housing (pay):
... the accompanying chart ...[with] that single line rising toward the heavens depicts the share of household real-estate assets as a percentage of gross domestic product. It's a graphic (in every sense of the word) description of the fantastic rise of the housing bubble. ... As David warns, "Caveat emptor whenever anything approaches 150% of GDP."
There are ... any number of reasons to be wary. Among them: Affordability is at a 14-year low; the sales of new and existing homes are leveling off or worse, even as prices continue to rise; inventories of unsold homes are more than ample; mortgage applications are running some 20% below the summer's high; and even a few -- make that a very few -- home builders insist that business is as good as it gets, but could get better.
Moreover, the regulators are growing restless, as they inevitably do when denial can no longer serve as adequate policy to cope with a speculative frenzy that's reaching fever pitch. ... the Comptroller of the Currency, the Fed, the FDIC and their kin who oversee the thrifts and the credit unions are busily drawing up drafts of rules they plan to issue before year-end to seriously tighten standards on risky loans.
Not surprisingly, those risky loans ... are those that cheerfully don't require the consumer to pay down principal; for their part, the originators of such loans ... haven't the foggiest real notion as to whether said consumer can afford the house he's buying. Since these exceedingly risky loans are ... "ubiquitous" a crackdown on them could ... "have a significant impact on the housing market, bank-lending activity and the broader economy, beginning in the first half of next year."
What has made the regulators more than a little antsy is that many of the folks taking interest-only or so-called option adjustable-rate mortgages (ARMs in the popular parlance) are due for brutal "payment shock" when the loans reset, as a heap of them are slated to do over the next several years. Resetting, in this instance, means that the suddenly-not-so-happy home owner, besides higher interest rates, will have to start paying down the principal, a double whammy that could raise his monthly mortgage payments by 50%, even 100%.
Since the bulk of option ARMs and interest-only loans are also "stated income" loans, in which the bank cheerfully accepts as income whatever the borrower says it is and no documentation is required, the shock -- and the consequences -- are sure to be that much greater for the borrower. In the circumstances, lenders might begin to feel a bit queasy as well.
Such risky (to put it mildly) loans, ISI reports, may account for nearly half of all the loans made in the past 18 months...
Saturday, December 03, 2005
Demographics GIF: 1920 - 2005
by Calculated Risk on 12/03/2005 01:20:00 AM
US Population distribution by age, every decade 1920 - 2000, plus 2005.
NOTE: Thanks to InsultComicDog for hosting this animation. Please see previous post for individual graphs.

Friday, December 02, 2005
Demographics: Baby Bust and Boom
by Calculated Risk on 12/02/2005 08:33:00 PM
The following graphs shows the US population distribution by age since 1920.
All data from the Census Bureau.
This is nothing new, but its interesting when considering the debates on Social Security, medical care, budget deficits or when considering investments that are related to demographics (like 2nd homes).
Click on graphs for larger image.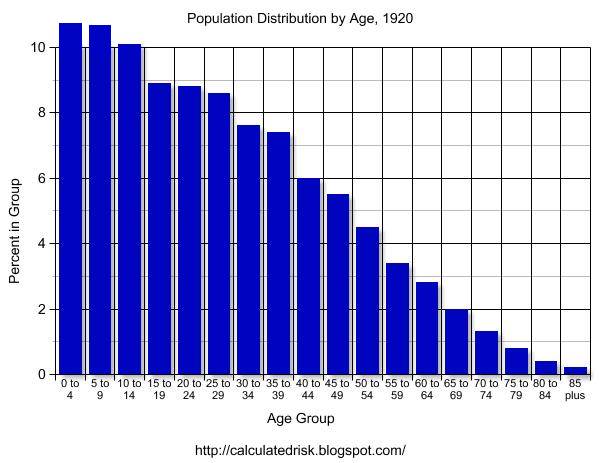
1920 The graphs for 1900 and 1910 have a similar shape as 1920. With the medical advances of the 20th Century, we would expect the shape of the distribution to become flatter as fewer people die of illnesses in the prime of their lives. Otherwise this represents the expected population distribution.
1930 Although 1930 has the general shape of the previous decades, the first evidence of the Baby Bust is apparent. Although 1929 is usually considered the start of the Depression, there was a large segment of America that was struggling economically several years earlier. This shows up in the drop in births.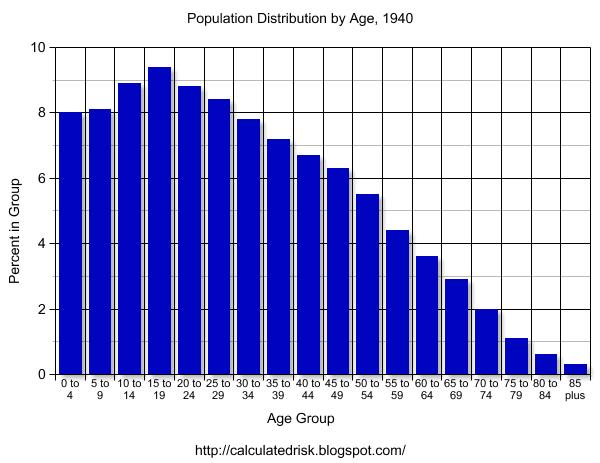
1940 The Depression era Baby Bust is evident in the 1940 census data. With tough economic times, it is no surprise that many families postponed having children.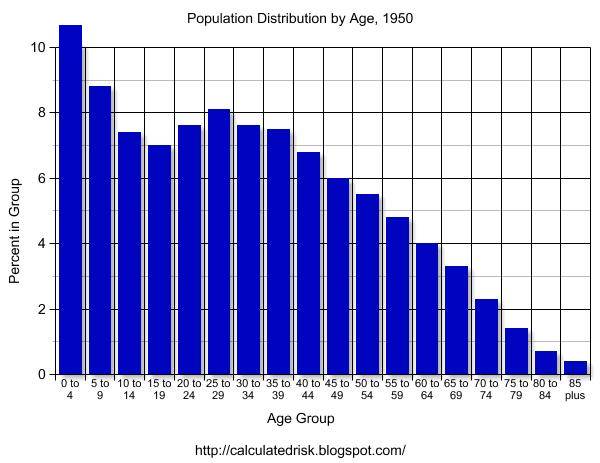
1950 Here comes the Baby Boom. The Boom actually started during World War II and really picked up after the war.
The Baby Bust is very clear on the graph.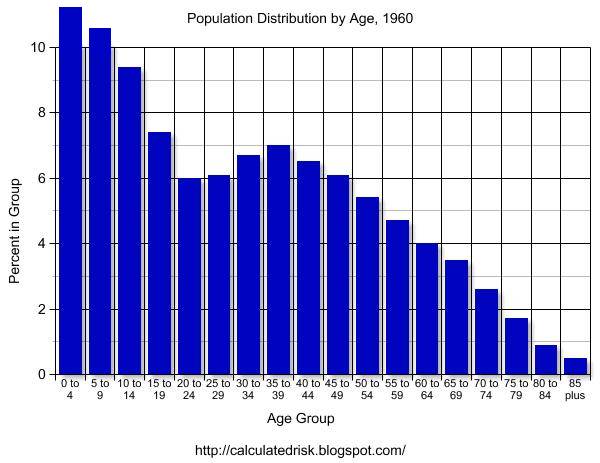
1960 The Baby Boom probably peaked in the mid-1950s.
The 1960 graph clearly shows both the Baby Bust of the '30s and the Baby Boom that followed.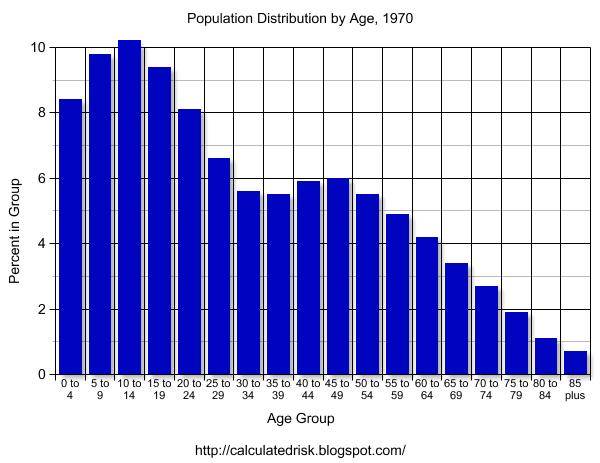
1970 The Baby Boom is over and a mini-bust has started. 
1980 By 1980, the Boomers are mostly in the workforce. Social Security is close to running a deficit and Alan Greenspan heads a commission to fix the program. The Greenspan commission recommends several changes, including having the Baby Boomers prepay their Social Security.
1990 By 1990, the Baby Bust is close to retirement. The Boomers are entering their peak earning years.
This combination of fewer retirees in the '90s (Baby Bust) and Boomers entering their peak earnings years is a positive for running huge Social Security surpluses and working towards balancing the Federal Budget. 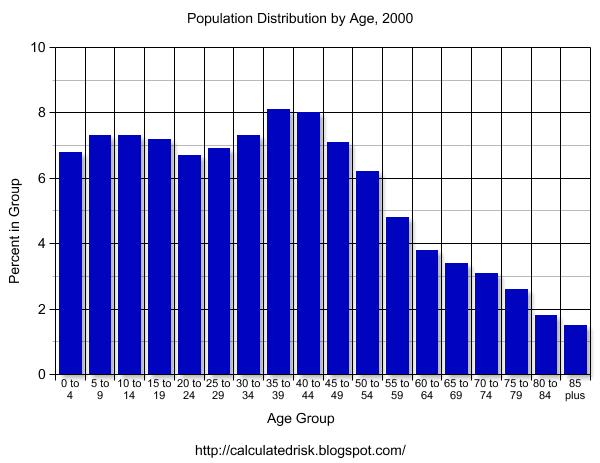
2000 By 2000 it is hard to distinguish the Baby Bust, but the Baby Boom is very clear. New entries into the population have been relatively steady for years. Even with the lower impact from the Baby Bust, medical costs are still straining the budget - and with the Boomers nearing retirement age, this is clearly a major issue for the US.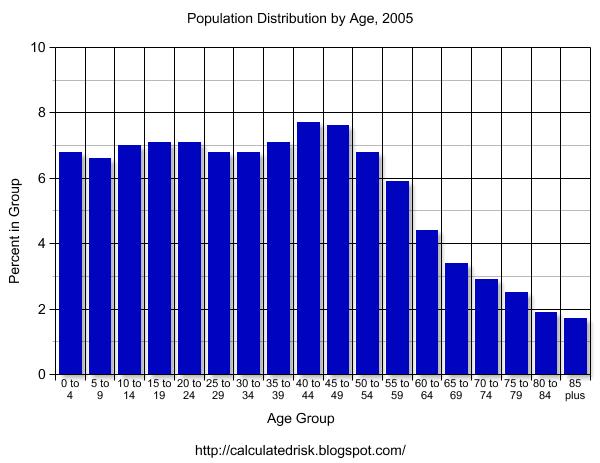
2005 And here is an interim population estimate from the Census Bureau. The distribution is starting to flatten out due to advances in medical care. The largest increases in the distribution have been in the older age groups (compare 2005 to 1920).
I will refer to these graphs in future posts. All comments are welcome.
Fiscal 2006: Record YTD Increase in National Debt
by Calculated Risk on 12/02/2005 01:24:00 PM
Fiscal 2006 is off to a poor start as the increase in the National Debt set a record for the first two months of the fiscal year. The National Debt increased $159.6 Billion to $8.092 Trillion as of Nov 30, 2005. 
Click on graph for larger image.
The previous record through November was in 2004 (fiscal 2005) with an increase in the National Debt of $146.2 Billion.
Each month I will plot the YTD increase in the National Debt and compare it to the proceeding years. I expect fiscal 2006 to set a new record for the annual increase in the National Debt.
Thursday, December 01, 2005
Housing: Remarks by Controller of the Currency
by Calculated Risk on 12/01/2005 09:03:00 PM
John C. Dugan, Controller of the Currency, remarked today on exotic mortgages and the housing market. The first half of his talk, before the Consumer Federation of America, concerned changes to credit card regulations. Here are his remarks (pdf) on negative amortization mortgage products:
"And so, just as we come to the end of the neg am story in credit card lending, I fear we are at the beginning of one in the mass marketing of home mortgages. One of the new “non-traditional” mortgage products you may have heard about is the so-called payment-option ARM – a mortgage that allows borrowers to select from a menu of payment possibilities, ranging from a fully amortizing monthly payment to the neg am payment option that does not cover the outstanding interest. Such products have been available for quite a long time, but until recently had been provided primarily to a narrow group of very creditworthy borrowers who found differing payment options to be an attractive “cash management” tool over time. In this niche market – which is different from the credit card market because of the collateral securing the loan – borrowers have generally had the wherewithal and sophistication to handle temporary periods of negative amortization without jeopardizing their ultimate repayment of principal.
In the last two years, however, we have seen a spike in the volume of payment-option ARMs, which are no longer largely confined to well-heeled borrowers who can clearly afford them. Increasingly, they are being mass marketed as “affordability products” to borrowers who appear to be counting on the fixed period of exceptionally low minimum payments – typically lasting the first five years of the loan – as the primary way to afford the large mortgages necessary to buy homes in many housing markets across the country. And as the loans become more popular, the prospect of using them to penetrate the subprime lending market cannot be far behind.
The fundamental problem with payment option ARMs, other than the growing principal balance due to negative amortization, is payment shock. A traditional 30-year fixed-rate mortgage requires the borrower to amortize the principal balance through equal payments over the 30-year life of the loan. In contrast, a typical payment-option ARM is a 30-year mortgage that permits five years of negative amortization by allowing a borrower to make very low minimum monthly payments during that period. Beginning in the sixth year, the borrower must begin paying the full amount of interest accruing each month, and must also begin amortizing the increased principal over the remaining 25-year life of the loan. The combination of these factors can produce sharply increased payments in year six. For example, a typical payment-option mortgage of $360,000 at 6 percent can produce a monthly payment increase of nearly 50 percent in that year, assuming no change in interest rates. If rates rise to just 8 percent, the payment increase when amortization begins would nearly double.
To the extent that they are planning for such contingencies, many payment-option-ARM borrowers calculate that they will be able to sell their property or refinance the mortgage by year six. But if real estate prices decline – and there already is evidence of softening in some markets – these borrowers could face the bleak prospect of loan balances that exceed the value of the underlying properties. In that case, selling the property or refinancing the loan would not be a viable escape valve for avoiding huge payment shocks.
In these circumstances, do consumers really understand the potential consequences of the neg am feature inherent in a payment-option ARM? Is this an appropriate product to mass market to customers who may be looking at the less than fully amortizing minimum payment as the only way to afford a larger mortgage – at least for the five years before the onset of payment shock? And are lenders really prepared to deal with the consequences – including litigation risk – of providing such products in markets where real estate prices soften or decline, or where interest rates substantially increase?
I fear the answer to all these questions may be “no.” That is one reason why, if all goes according to plan, the Federal banking agencies will propose new guidance with respect to nontraditional mortgage products by the end of this month. While the guidance will cover many other issues besides negative amortization and payment option ARMs, these will certainly be central among the topics addressed. I am mindful of the history of neg am products in credit cards, and I recognize that the nationwide mass marketing of neg am mortgages is in its infancy. As a result, I firmly believe that the guidance should draw clear lines about appropriate standards for qualifying borrowers for payment option ARMs that explicitly take into account potential payment shock. Put another way, lenders should not encourage or accept applications from borrowers who clearly cannot afford the dramatically increased payments that are likely to result at the end of the five-year, low minimum payment period. Disclosures should also be clear, timely, and meaningful. And lenders should have very substantial controls in place to manage the potential risk of such loans."
Quarterly House Appreciation by State
by Calculated Risk on 12/01/2005 03:04:00 PM
In addition to YoY appreciation rates, the OFHEO HPI also presents the quarterly appreciation by state. Every state had positive price increases for Q3 2005.
The worst performing states in Q3 were Michigan (0.89% quarterly increase, 3.6% annual rate) and Kansas (0.94% quarterly increase, 3.8% annual rate).
The best was Arizona (7.3% quarterly increase or a 32.6% annual rate). The following map shows the state by state quarterly appreciation:
Quarterly Appreciation:
Red: Greater than 5%
Dark Orange: 4% to 5%
Light Orange: 3% to 4%
Purple: 2% to 3%
Light Blue: 1% to 2%
Dark Blue: less than 1%
Its important to note these are quarterly rates.
Florida, the DC area and the West Coast continue to see the most price appreciation. Massachusetts has cooled substantially as inventories have increased, although prices still appreciated 1.4% for Q3 (or 5.7% annual rate).
House Price Index Shows 12 Percent Annual Increase
by Calculated Risk on 12/01/2005 10:19:00 AM
The Office of Federal Housing Enterprise Oversight (OFHEO) released (pdf) their Q3 House Price Index this morning.
UPDATE: See Kash's Post: House Prices. Kash breaks the numbers down by some of the hotter markets.
Average U.S. home prices increased 12.02 percent year over year from the third quarter of 2004 through the third quarter of 2005. This represents a two ercentage point decline from the previous four-quarter appreciation rate of approximately 14 percent. Appreciation for the most recent quarter was 2.86 percent. The figures were released today by OFHEO Acting Director Stephen A. Blumenthal, as part of the House Price Index (HPI), a quarterly report analyzing housing price appreciation trends.
“Appreciation rates in the third quarter were extremely strong, although some deceleration can be seen in a number of the faster-appreciating markets,” said OFHEO Chief Economist Patrick Lawler. “Price momentum in the Pacific and New England states, in particular, has pulled back.”
House prices grew more rapidly over the last year than did prices of non-housing goods and services reflected in the Consumer Price Index. House prices rose 12 percent, while prices of other goods and services rose only 4.5 percent.
Appreciation rates in the Pacific Census Division fell from last quarter, but remain higher than in other areas. At slightly less than 16.9 percent, the four-quarter appreciation rate in the South Atlantic Division now trails appreciation in the Pacific by less than one-half a percentage point.
Other significant findings in the HPI:
1. Price growth in Arizona continues to accelerate, with a one-year appreciation rate of 30 percent, the largest of any state by a wide margin.
2. Florida became the second fastest-appreciating state, with four-quarter appreciation of 25 percent and 11 of the 20 highest ranked Metropolitan Statistical Areas (MSAs).
3. Nevada’s four-quarter appreciation rate declined by more than 10 percentage points from the previous rate of 28.6 to 17.6 percent.
4. Two states that continue to show noticeable house price appreciation are Idaho and Utah. Idaho, with an appreciation rate of 15.1 percent on a four-quarter basis, is now ranked 12 among states, up from 20 in the previous HPI report. With annual price growth of 11.4 percent, Utah’s ranking jumped to 22, compared with 31 in the previous HPI report and last place in the fourth quarter of 2003.
5. With a four-quarter appreciation rate of 34.4 percent, Phoenix-Mesa-Scottsdale, AZ topped the list of the fastest appreciating MSAs for the first time since OFHEO began publishing its index in the fourth quarter of 1995. Last quarter’s top MSA, Naples-Marco Island, FL, dropped to number three.
6. For the first time since the fourth quarter of 2003, the list of the Top 20 MSAs having the highest appreciation does not contain any Nevada cities. Reno-Sparks, NV, the fourth ranked market last quarter is now 29 among the 265 ranked MSAs. Also, Las Vegas - Paradise, NV has fallen from 21 to 77, with four-quarter appreciation of 13.77 percent.
“Much of the recent run-up in mortgage rates occurred after the third quarter ended,” said Lawler. “To the extent that those increases may have affected prices, those effects will be evident in future quarters.”
Changes in the mix of data from refinancings and house purchase transactions can affect HPI results. This HPI report includes an index that is calculated using only purchase price data. The index shows an increase of 10.95 percent for the U.S. between the third quarter of 2004 and the third quarter of 2005.


