by Calculated Risk on 12/08/2005 09:11:00 PM
Thursday, December 08, 2005
Household Valuation Change: FED vs. OFHEO
With the release of the Flow of Funds report today, I decided to compare the FED's estimate of the total value of household real estate with the OFHEO House Price Index (HPI). Of course OFHEO only reports the nominal change in house prices, so the comparison is really between the changes in valuation (either annually or quarterly).
I thought this might be interesting, mostly to see if there is a difference between the two approaches. The FED reports the total valuation of household real estate. This includes any new stock put into place and improvements to existing stock. OFHEO reports the change in the price of existing stock.
To compute the annual change for the FED for existing stock, I started with year N. For year N+1, I subtracted construction estimates from the Census Bureau of new private single family construction and improvements.
Click on graph for larger image.
The first graph shows the annual change from both the FED (subtracting new construction as above) and the OFHEO HPI. Clearly both methods yield similar results and I don't see any systemic bias either way.
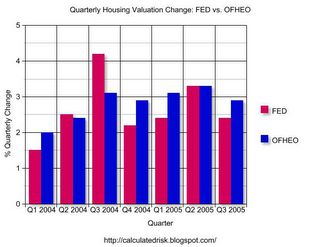
The second graph is for the last seven quarters, and shows the quarterly change for both sets of data.
Once again both methods yield similar results with no discernible bias. This gives me a little more confidence in both data sets, unless the FED uses the OFHEO HPI as part of their calculation!


