 RSS Feed
 by Calculated Risk on 12/19/2005 03:13:00 PM
Monday, December 19, 2005
Home Builders Confidence Falls
Please see Angry Bear for National Association of Home Builders HMI excerpts and links to historical tables.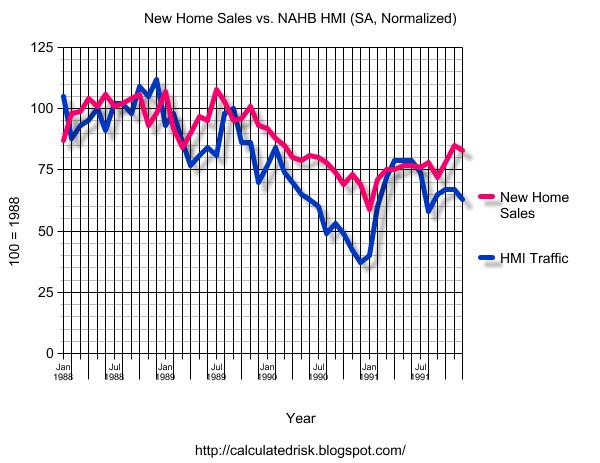
Click on graph for larger image.
This graph shows New Home Sales vs. the NAHB traffic index from 1988 to 1991. Both series are seasonally adjusted and are normalized to 1988 = 100.
It appears that the NAHB index was generally a coincident indicator for New Home Sales in the previous housing slowdown.
With the fall in the NAHB HMI, I expect a similar fall in New Home Sales on Friday.


