 RSS Feed
 by Calculated Risk on 9/13/2005 06:45:00 PM
Tuesday, September 13, 2005
Trade Deficit: Another Look
General Glut and Dr. Setser have some excellent analysis on the trade deficit today. In the comments of General Glut's blog, Vorpal points out that the trade deficit is a record NSA (Not Seasonally Adjusted). Vorpal wrote:
"I wouldn't trust the [seasonal] adjustments because the nature of the deficit is changing so rapidly that historical precedent may be inaccurate."Comment on Seasonal Adjustment: I believe the Census Bureau and the Bureau of Economic Analysis does the best possible job of seasonally adjusting these numbers. Vorpal makes a keen observation; the nature of portions of the deficit are changing rapidly and we need to look at several months worth of data and consider the NSA data too. For a brief description of adjustments, see this post (2nd graph and discussion). Although I didn't discover any apparent problems with the seasonal adjustment, Vorpal's comments did lead me to the following:

Click on graphs for larger images.
If we break down the NSA imports into three components (petroleum, China, and other) we see something possibly interesting. Petroleum imports are growing significantly and set another record in July.
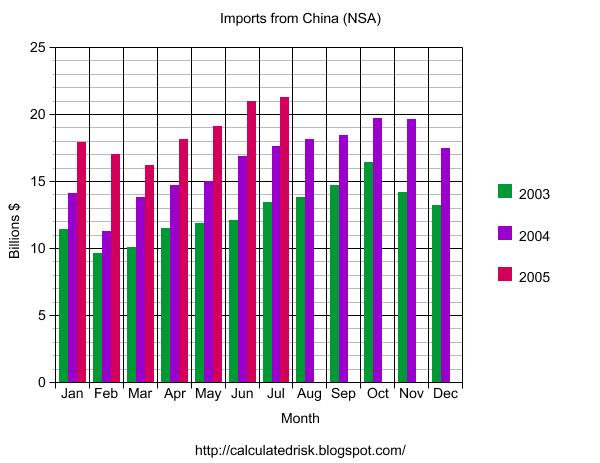
Imports from China also set another record in July. Imports from China follow a clear seasonal pattern and we can expect imports to continue to rise for the next several months.
NOTE: The Long Beach and Los Angeles ports implemented the OffPeak initiative (adds late night hours to port operations) starting on July 23rd to handle the expected heavier late summer / fall imports. I expect August to be a strong month for imports from China.
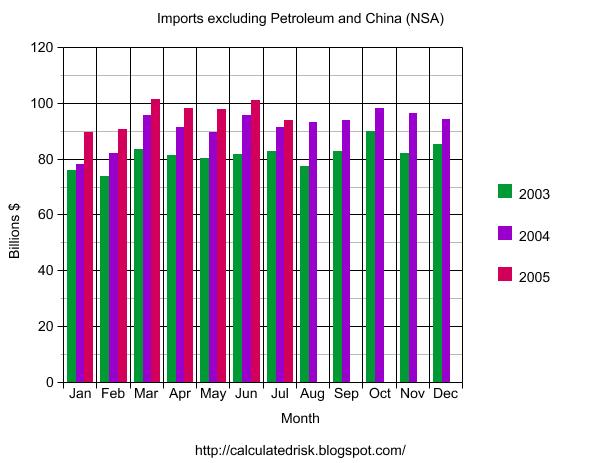
While Petroleum imports and imports from China are setting records, other imports have shown relatively sluggish growth.
Perhaps the relatively weak dollar has slowed imports from other countries.
The final graph shows the trade deficit for goods excluding imports and exports of petroleum and China.
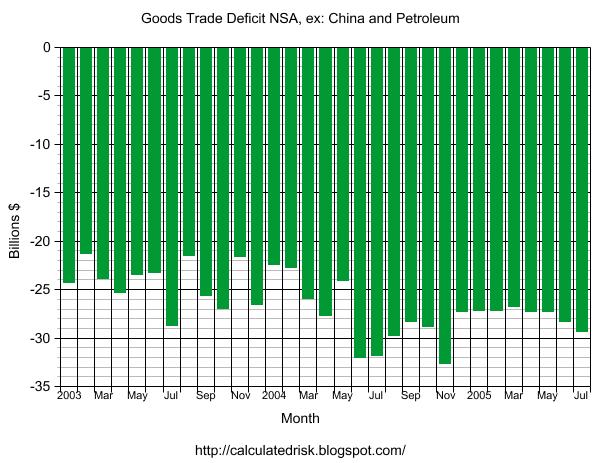
This graph shows that the "other" goods trade deficit (excluding services, and goods with China and Petroleum) peaked last summer. Perhaps that is why the dollar stopped falling earlier this year. Unfortunately it appears the "other" deficit is starting to climb again, and combined with more NSA records for China and petroleum products, I expect record SA trade deficit numbers over the next few months.


