 RSS Feed
 by Calculated Risk on 7/14/2005 04:37:00 PM
Thursday, July 14, 2005
Deficit Improvement?
The following graph shows the fiscal year to date increase in the National Debt for each of the last six fiscal years. The "fiscal year" is the accounting period of the federal government. It begins on October 1st and ends on September 30th of the next calendar year. Each fiscal year is identified by the calendar year in which it ends - so fiscal year 2005 ends on September 30, 2005.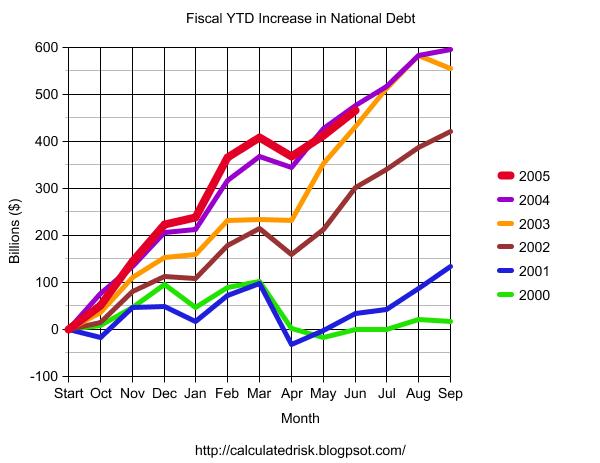
Click on graph for larger image.
The Year to Date increase in the National Debt is plotted for fiscal years 2000 through 2005. For 2005 (in RED) the data is plotted through June, 2005. The graph shows that contrary to the claims of the Bush Administration there has only been minor improvement in the overall deficit picture for 2005.
NOTE: There are many methods of looking at the annual budget deficit. The Bush Administration uses the "Enron Method" commonly called the "unified budget deficit". For a comparison of the unified budget deficit, the general fund deficit and the increase in the National Debt method see "Another Budget, Another Disaster".


