 RSS Feed
 by Calculated Risk on 4/12/2005 08:49:00 AM
Tuesday, April 12, 2005
Record US Trade Deficit: $61 Billion for February
The U.S. Census Bureau and the U.S. Bureau of Economic Analysis released the monthly trade balance report today for February:
"... total February exports of $100.5 billion and imports of $161.5 billion resulted in a goods and services deficit of $61.0 billion, $2.5 billion more than the $58.5 billion in January, revised.
February exports were $0.1 billion more than January exports of $100.4 billion. February imports were $2.6 billion more than January imports of $158.9 billion."
Click on graph for larger image.
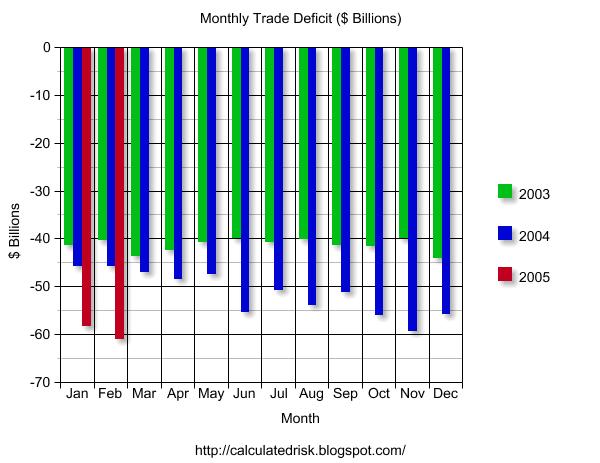
This graph shows the monthly trade balances for 2003, 2004 and 2005 and depicts the worsening year over year trade imbalance. The February trade deficit was an all time record, as exports stalled and imports continued to climb.
The recent increase in oil prices did not impact the February trade deficit. In fact, Oil imports were down slightly in February. The following graph shows the impact of imported oil on the trade deficit.
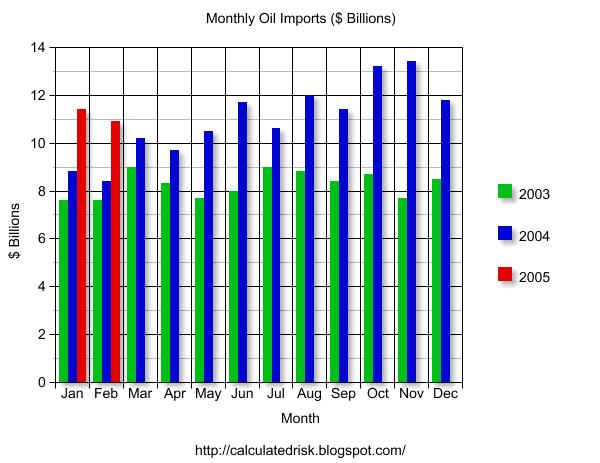
This graph shows oil imports per month for 2003, 2004 and the first two months of 2005. Oil imports are less than 20% of the trade deficit and just over 1% of GDP (as discussed in this post on Angry Bear). Even without oil, the trade deficit would be 5% of GDP - a serious problem.
The recent run up in oil prices will impact the trade deficit for March.
UPDATE: The average contract price for crude oil in Feb was $36.85 per barrel. According to the DOE, the average price will be almost $10 higher for March. That will add $4.5 Billion to the trade deficit, before seasonal adjustments - or another $3.5+ Billion to imports in March.
I expect the trade deficit for March to even be worse!


