 RSS Feed
 by Calculated Risk on 3/02/2005 02:53:00 AM
Wednesday, March 02, 2005
Update: New Home Sales as Leading Indicator
In my earlier post, I suggested that the volume of New Home Sales might be a leading indicator for a consumer led economic slowdown. One of the questions I was asked was how many times did housing decline and the economy not slide into recession (a false positive)? Another reasonable question would be how many recessions does the signal miss (a false negative)?
We only have 42 years of data from the Census Bureau that includes 6 recessions. This is a very small sample. A housing slowdown did not immediately precede either the 1969 or 2001 recessions (the 2001 recession was mostly business related). The following graph shows the annual volume of New Home Sales since 1963 (the earliest data from the Census Bureau).
NOTE: The annual data loses resolution and does not show all of the information contained in the previous post's graphs.
The shaded lines on the graph are approximate and represent U.S. economic recessions.
Click on the graph for a larger image.
Source: Census Bureau


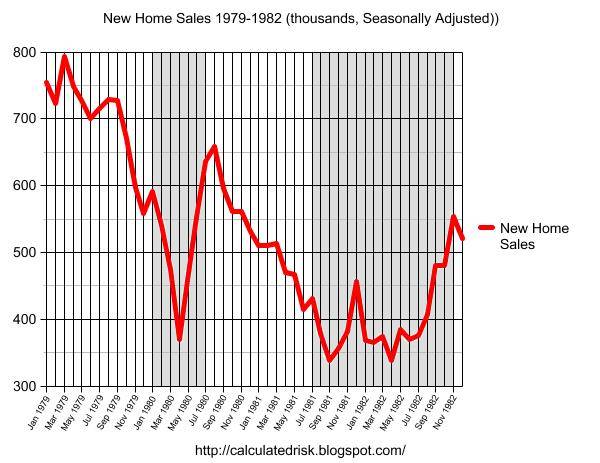
Here is a graph from the earlier post showing housing and the early '80s recession. Compare that to the double dip recession in the previous graph. In this graph we can see the monthly detail and that the declining volume of New Home Sales were a reasonable leading indicator for both economic recessions.
Source: Census Bureau
K Harris pointed out some potential anomalies in the Census Bureau data. It is very possible that the January numbers were impacted by weather or other factors. I was NOT suggesting that the January drop in housing was indicative of a slowdown, only that if housing volumes continue to decrease that that might be a strong leading indicator. For this indicator to suggest an economic slowdown, the volume of New Home Sales would have to continue to decline over the next few months.
Predicting recessions is very difficult. The only reliable indicator is a flattening (or inverted) yield curve - and the running joke is that the yield curve has predicted 11 of the last 7 recessions! Also there is a strong incentive for most economists to always be bullish on the economy. Nobody will blame you if you miss a turning point, but to cry wolf is a disaster for your reputation. Here are a couple of examples from the Fed Chairman Alan Greenspan:
"It is very rare that you can be unqualifiedly bullish as you can be now."
Alan Greenspan, Jan 1973 (about 6 months before the economy went into recession).
"But such imbalances and dislocations as we see in the economy today probably do not suggest anything more than a temporary hesitation in the continuing expansion of the economy."
Alan Greenspan, Jan 1990 (about 6 months before the recession)
I'm not picking on Mr. Greenspan, just using him as an example. Here is another example: The WSJ conducted a survey of 40 economists in July 1990, and only one predicted a recession. The Journal went so far as to ridicule the one economist predicting a recession, suggesting that he "now has predicted four of the past zero recessions." With hindsight we now know that in July 1990 the economy was ALREADY in recession!
For an excellent analysis of recession prediction, I suggest the following paper by the IMF's Prakash Loungani "The Arcane Art of Predicting Recessions".


