by Calculated Risk on 3/15/2005 11:39:00 PM
Tuesday, March 15, 2005
California Real Estate Prices: Boom and Bust
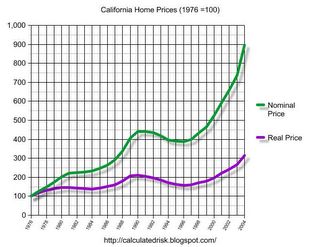
Today I heard someone comment that California Real Estate never goes down. In fact, California RE has declined in the past in both real and nominal terms.
Click on graph for larger image.
This graph shows the price of California RE based on the OFHEO California housing index. For the real price, the nominal price is adjusted by CPI, less Shelter, from the BLS.
(1976 = 100)
The graph shows that in real terms we have seen two declines since 1980. The first decline, in the early '80s, lasted 3 years. The second decline, in the early to mid '90s, lasted 6 years.
The second graph shows the same information by annual rate of return, both real and nominal.
The decline in the '90s lasted 24 quarters from peak to trough. It took 9 years for prices to recover in nominal terms to their early '91 peak. Overall prices declined 12% in nominal terms and 26% in real terms.
Even more important for the economy are the coincident declines in sales volume. Real Estate prices are “sticky downward” since sellers are slow to adjust their prices down, and buyers are reluctant to buy a declining price asset. In this regards, real estate is an imperfect market in that prices adjust slowly to changes in supply and demand (unlike commodities like corn or wheat). Although prices do decline, it’s the decline in volume that leads to declining employment in real estate related occupations like construction, RE sales, mortgages, and more, and impacts the general economy.


